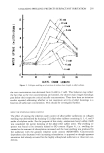
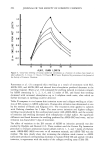
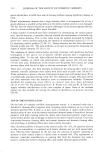
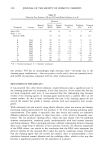
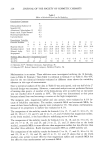
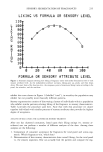
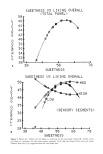
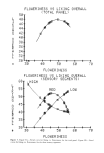
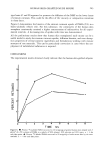
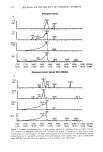
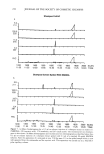
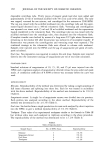
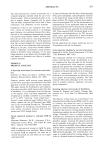
( TOTRL LI 4 "i L I K I NG !]IJERALL PANEL ) 58 ': W E E T N E :-' S S[,]EE I']ESS IJS LIKING OVERALL L I K I N G i] E R A L L 58 MED 45 48 ,"35 ,"31..'3 LOW SENSORY HIGH .SEGMENTS ) 25 28 . 30 40 50 60 70 S [,.I E E T N E S S Figure 4. Figure 4A--Fitted curve for liking vs. sweetness, for the total panel. Figure 4B--Fitted curves for liking vs. sweetness, for the three sensory segments. Note that the shapes of the curves are quite different from the sl ,pe suggested from the total panel data.

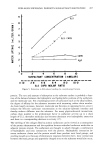
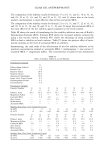
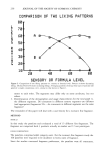
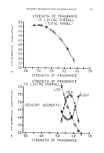
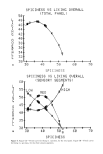
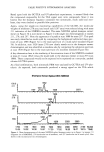
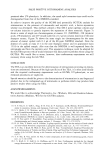
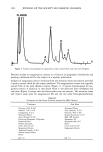
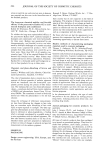
L I K I G 0 E R L L 58 48 4G 44 42 40 .• 4 F L rl •,] E R I N E S S U S L I K I N G (TOTAL PANEL) 0 U E R A L L •0 40 = • .-, ._,0 60 ,"C• F L 0 [,] E R I N E '.: S L I K I N G o u E R A L L 55 58 45 48 35 38 FLOWERINESS US LIKING OUERALL SENSORY SEGMENTS ) MED LOW • 30 40 50 60 70 F L 0 W E R I N E S S Figure 5. Figure 5A--Fitted curve for liking vs. fioweriness, for the total panel. Figure 5B--Fitted curves for liking vs. fioweriness, for the three sensory segments.
Purchased for the exclusive use of nofirst nolast (unknown)
From: SCC Media Library & Resource Center (library.scconline.org)