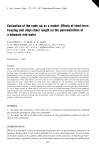
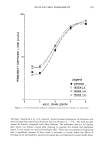
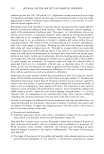
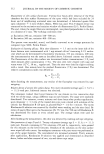
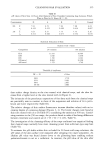
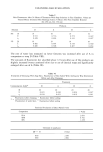
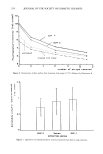
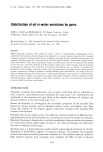
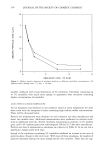
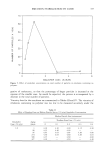
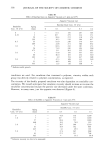
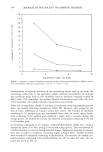
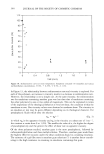
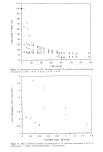
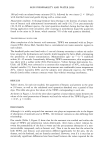
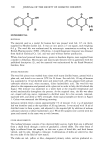
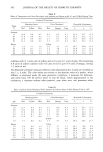
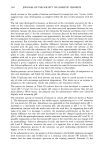
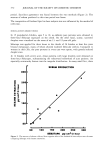
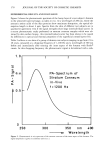
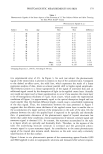
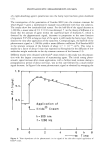
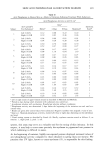
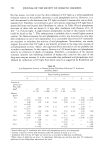
378 JOURNAL OF THE SOCIETY OF COSMETIC CHEMISTS EXPERIMENTAL RESULTS AND DISCUSSION Figure 2 shows the photoacoustic spectrum of the horny layer of a test subject's forearm in the ultraviolet spectral range, as taken in vivo. At a wavelength of 280 nm, where the aromatic amino acids of the skin proteins show maximum absorption, the optical ab- sorption length is about 4 •xm. Spectra from the skin of different test subjects are in qualitative agreement even if the signal strengths show large interindividual scatter. In a recent photoacoustic study performed on stratum corneum samples which were ob- tained by skin surface biopsy, this interindividual scatter has been shown to be caused by differences in optical and thermal properties of the superficial corneal layers (10). Table I collects in vivo data of a group of thirteen test subjects ranging in age from 24 to 28 years, measured at a chopping frequency of 1,200 Hz and a wavelength of 300 nm before and immediately after treating the inner aspect of the forearm with Ilrido © cream. At this chopping frequency the photoacoustic signal is determined with a rela- 1.0 0.5 0 I 250 300 I I PA-Spectrum of Stratum Corneum in-Vivo f = 1200 Hz I 350 nm /,00 Wavelength Figure 2. Photoacoustic in vivo spectrum of the stratum corneum of the inner aspect of the forearm. The signal amplitude is given in arbitrary units (a.u.).

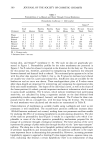
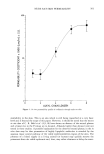
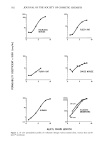
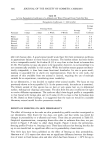
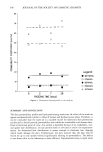
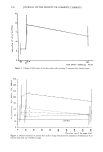
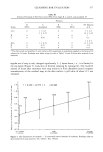
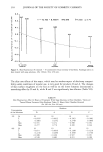
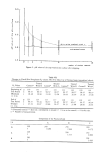
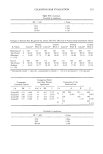
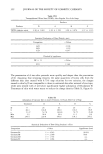
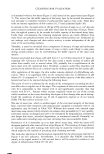
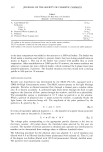
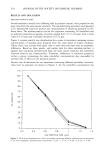
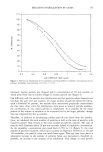
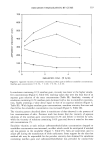
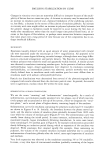
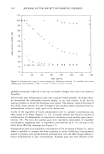
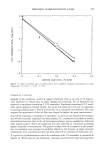
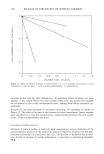
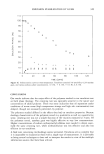
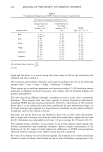
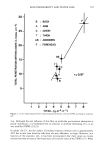
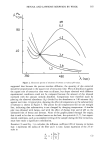
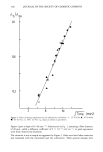
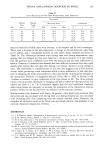
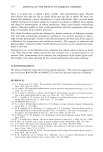
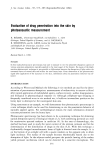
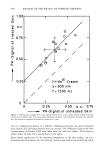
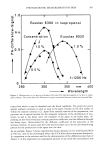
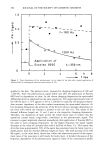
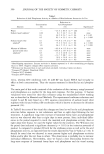
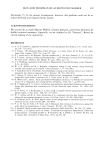
PHOTOACOUSTIC MEASUREMENTS ON SKIN 379 Table I Photoacoustic Signals of the Inner Aspects of the Forearms of 13 Test Subjects Before and After Treating the Skin With Ilrido © Cream Photoacoustic Signals (a.u.) Untreated Treated Subject Sex Age Skin Skin Difference 1 M 28 0.20 0.43 0.23 2 M 26 0.25 0.47 0.22 3 F 24 0.47 0.77 0.30 4 M 26 0.18 0.43 0.25 5 F 26 0.47 0.82 0.35 6 M 24 0.25 0.46 0.21 7 M 27 0.59 0.78 0.19 8 F 25 0.49 0.68 0.19 9 M 27 0.38 0.59 0.21 10 M 25 0.26 0.52 0.26 11 M 26 0.40 0.63 0.23 12 M 24 0.37 0.68 0.31 13 F 25 0.34 0.70 0.36 Mean: 0.358 0.612 0.255 -+ SD: 0. 125 0. 139 0.058 Chopping frequency 1,200 Hz wavelength 300 nm. tive experimental error of 4%. In Figure 3, for each test subject the photoacoustic signal of the treated skin is plotted in relation to that of the untreated skin. Compared to the dashed no-effect-curve, the solid line, which represents the result of a linear regression analysis of data, shows an almost parallel shift to higher signal amplitudes. This behavior points to a linear superposition of the signal of untreated skin and an additional signal caused by the absorption of light in the applied cream layer. Actually one would not expect such a linear superposition to occur if one assumes the cream layer to be of homogeneous thickness of 3 •m. Such a layer, which under the experimental conditions of Figure 3 is approximately equal to the optical absorption length and not much smaller than the thermal diffusion length, would cause a considerable weakening of the skin signal. Thus, the interrelation between the data presented in Figure 3 suggests that the effective mean thickness of the applied cream layer is smaller due to the accumulation of a larger portion of the preparation in the sulci of the skin. On the plateaus between the sulci the applied layer is expected to be optically and thermally thin. A quantitative discussion of the photoacoustic signal of layered structures has shown that under these conditions a linear superposition of stratum corneum signal and sunscreen signal is obtained (11). In contrast, the sunscreen accumulated in the sulci is in layers which are optically and thermally thick. Therefore, in the regions of the sulci the underlying stratum corneum is screened and the generated photo- acoustic signal is a pure sunscreen signal. Its contribution to the mean photoacoustic signal of the treated skin remains small, however, as the sulci cover only a relatively small fraction of the skin surface. Figure 4 shows in vivo photoacoustic spectra of the sunscreening agents Eusolex 6300 and 8020 applied to skin in isopropanolic solutions and measured after solvent evapora-
Purchased for the exclusive use of nofirst nolast (unknown)
From: SCC Media Library & Resource Center (library.scconline.org)