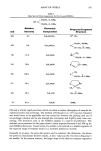
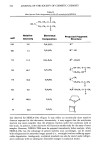
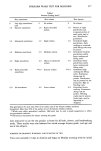
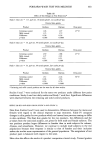
FOREARM WASH TEST FOR MILDNESS 359 forearms. They used visual, tactile, and sensory assessments of softness, dryness, flaking, itching, clean feel, and mildness of the test products. These attributes were rated on a nine-point scale, -4 to + 4, on which negative values indicated poor skin condition and positive values indicated good skin condition. Transepidermal water loss (TEWL) measurements were made with a single-probe evaporimeter (Servo-Med, Stockholm, Sweden, Model EP-1C) equipped with a glass chamber filled with LiC1 dessicant to eliminate air currents and maximize flux. The probe was held in contact with the midpoint of the volar aspect of the forearm for 60 seconds to obtain a reading at equilibrium. STATISTICAL ANALYSIS Pair test. The paired t-test was used on the one-week and two-week skin grades to test for significant treatment effects. Single product tests. An analysis of covariance was performed on the one-week and two- week skin grades for each test product, using the initial grade as the covariate. Fol- lowing this analysis, p-values were calculated for comparison of the adjusted treatment means. RESULTS AND DISCUSSION EFFECT OF FORMULATION VARIABLES (STUDY 1) Table II gives the smoothness, redness, and dryness final-grade means for the ten exper- imental bar soap formulations tested in a single product format in Study 1. These experimental formulations included three mixed soap/synthetic bars and seven soap bars which varied in tallow-coconut ratios (from 100% tallow to 100% coconut), with and without superfatting. Superfatted bars are made with free fatty acid in excess of the caustic component. Clinical results indicate that skin mildness improves with increasing tallow content and decreasing coconut content. A correlation coefficient (r = 0.97) was calculated for the composite grades (average of smoothness, redness, and dryness grades for a product) of the unsuperfatted formulations in Table II vs. tallow-coconut ratio. The composite grades for the all-tallow and the all-coconut formulations are significantly different at p = 0.02. The grades in Table II also indicate that superfatted formulas are milder than unsuperfatted formulas as shown by a comparison of 87T/13Cn with and without su- perfatting. This effect has been confirmed in subsequent paired-comparison studies. Furthermore, skin grades indicate that synthetic formulations range from very mild to very irritating. For example, a soap/synthetic formulation containing only AGS (alkyl [c-12] glyceryl ether sulfonate) was milder than a soap/synthetic formulation containing AGS and AS (alkyl [c-12,14] sulfate) with respect to smoothness (p = 0.03), redness (p = 0.06), and dryness (p = 0.21). This result was consistent with our finding that AS was a more irritating surfactant than AGS in guinea pig patch testing (unpublished results).

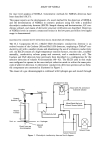
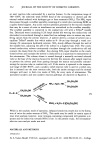
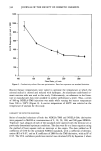
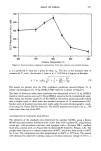
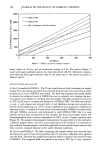
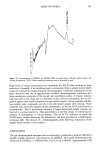
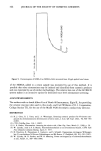
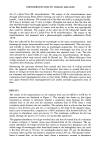
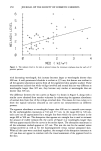
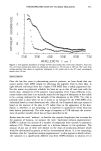
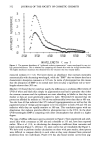
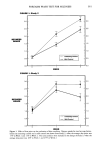
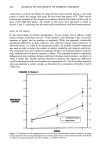
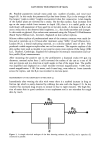
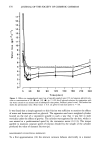
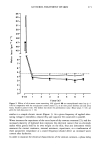
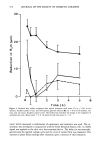
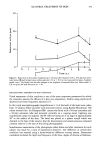
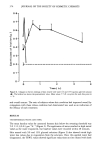
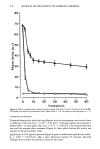
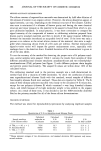
360 JOURNAL OF THE SOCIETY OF COSMETIC CHEMISTS Table II Comparison of Experimental Bar Soap Formulations for Skin Mildness Treatment code Experimental formulation Two week clinical skin grades Smoothness Redness Dryness Composite A. Synthetic (isethionate), 85T/15Cn soap, superfatted 1.70 c,E,G,H,J 1.22B-J 1.99 c-u'G-J 1.64 B. Synthetic (AGS), 60T/40Cn soap 2.35 c 1.94 2.44 2.24 C. Synthetic (AS, AGS), 80 T/20Cn soap 3.11 •)'v'H'l 2.46 2.74 2.77 D. All-tallow soap 2.27 2.13 2.61 2.34 E. 87T/13Cn soap 2.54 2.23 2.57 2.45 F. 87T/13Cn soap, superratted 2.21 2.12 2.37 2.23 G. 70T/30Cn soap 2.53 2.13 2.70 2.45 H. 70T/30Cn soap, superratted 2.39 2.05 2.64 2.36 I. 50T/50Cn soap 2.38 2.27 2.84 2.50 J. All-coconut soap 2.95 v 2.77 B,D,v-H 3.02 u'v 2.91 Superscript product codes indicate statistically significant differences between product grades at p • .05. (For example, the redness grade for experimental product J is statistically different from the redness grades for products B, D, F, G and H at p • .05). The study involved single product design with twenty-seven female subjects per product. Washing proce- dure consisted of a six-second lather work-up on a non-woven paper towel (Masslinn, Chicopee, NJ), ten-second application to the forearm, and a fifteen-second rinse. Subjects were washed four times daily, twice in the morning and twice in the afternoon, for five days, followed by two days without controlled washing, and then they were washed four times daily for an additional four days. Two-week clinical skin grades given in this table have been adjusted for initial condition by covariance analysis. EFFECTS OF CLIMATIC CONDITIONS Kligman et al. (1) stated that warm and humid weather conditions, prevalent during the summer months in much of the U.S., would nullify the possibility of discrimi- nating among soaps for mildness. Results described for Study ! were obtained from clinical testing in the dry climate of Tucson, Arizona, where the average dew point is less than 40øF for seven months of the year. The effect of dew point on the dryness grades produced by two bar soap formulations (an irritating control and a mild control) is illustrated in Figure !. The average dew points were quite low (!7øF. and !!øF.) for both weeks of this test (Study 2). The dryness grades for both products separated after one week, and continued to increase under the influence of drying conditions in the second week. In Study 3 (Figure 1), however, there was a large increase in the average weekly dew point between the first and second week. The dew point averaged !6øF. during the first week of the study, and increases in skin dryness grades were observed for both test products. In the second week of Study 3 the average dew point was 47øF. and there was no change in the irritating control group. There was an improvement (i.e., grade re- duction) in skin condition of the mild control group. We have found that when the dew point is greater than 40øF., it is more difficult to demonstrate differences between bar soaps. It is possible, however, to compensate for adverse climatic conditions by using a wash protocol in which the treatments are ap- plied four times each day (two times at each session) rather than twice. Figure 2 shows
Purchased for the exclusive use of nofirst nolast (unknown)
From: SCC Media Library & Resource Center (library.scconline.org)