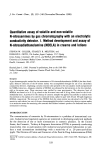
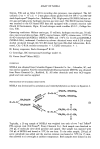
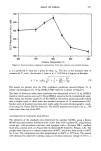
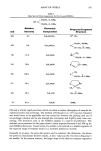
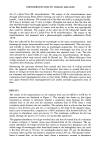
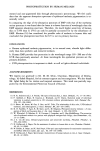
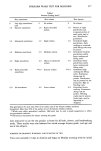
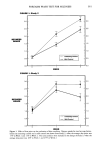
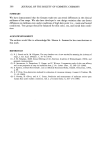
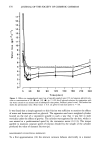
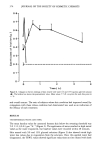
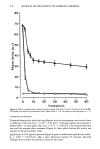
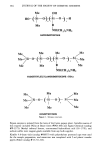
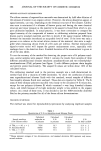
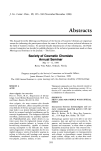
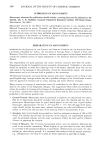
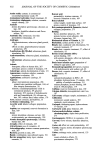
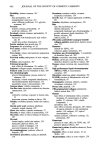
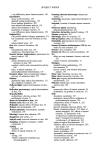
FOREARM WASH TEST FOR MILDNESS 361 FIGURE 1: Study 2 DRYNESS GRADE 3.0 2.5 2.0 1.5 1.0 0.5 0.0 Control Mild Control o 1 2 WEEK FIGURE 1: Study 3 3.0 2.5 2.0 1.5 1.0 0.5
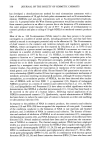
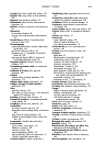
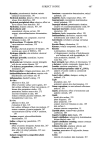
Irrititating 0.0 DRYNESS GRADE 3.0 2.5 2.0 1.5 1.0 0.5 Control Mild Control 3.0 2.5 2.0 - 1.5 - 1.0 - 0.5
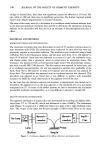
Irrititating o.o I I , I o.o o 1 2 WEEK Figure 1. Effect of dew point on the evaluation of skin condition. Dryness grades for two bar soap formu- lations (an irritating control and a mild control) are shown from Study 2, when the average dew point was 17øF in Week 1 and 1 IøF in Week 2. The same products were included in the design of Study 3, when the average dew point was 16øF in Week 1 and 47øF in Week 2.

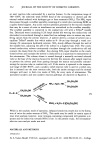
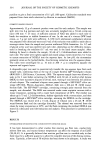
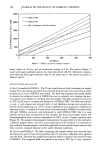
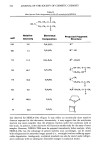
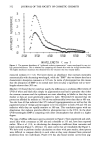
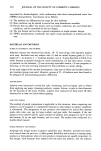
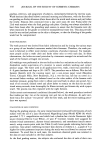
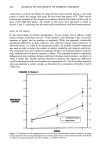
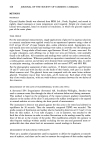
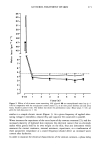
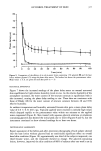
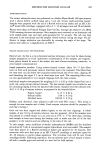
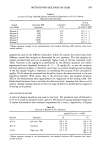
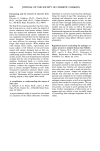
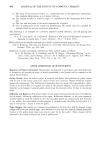
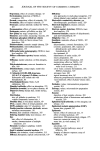
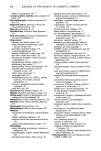
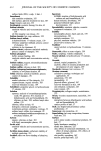
362 JOURNAL OF THE SOCIETY OF COSMETIC CHEMISTS results from a clinical test (Study 4) using the four-wash protocol during a two-week period in which the average dew point for each week was nearly 50øF. These results indicate that increases in skin dryness were observed during both weeks of the study in spite of the high dew points. The results in this study were equivalent to those in Studies 2 and 3, indicating that the same results are achieved with both wash protocols. EFFECT OF TEST DESIGN In the initial phase of method development, the test design was as follows: single product design, small base sizes (25-30 per product), four washings a day, ten-second exposure to lather, and no washing on weekends. With this approach, statistically significant differences in skin condition were observed among certain products, as shown for Study 1 in Table II. In subsequent studies, the method of paired comparison was used in order to reduce the subject-to-subject variability and improve sensitivity. The initial pair tests were conducted on groups of about one hundred subjects with two daily washings and ten-second exposure to lather. This approach resulted in significant differences in skin condition between mild and irritating control products, as shown in Study 5 (Table III). Further method refinement indicated that significant differences could be determined with much smaller test populations (25-30) if the lather exposure time was extended to ninety seconds, as illustrated by a comparison of Studies 5 and 6 (Table III). FIGURE 2: Study 4 DRYNESS GRADE 3.0 2.5 2.0 1.5 1.0 0.5 Mild Control ] - 3.0 2.5 2.0 - 1.5 ß 1.0 0.5 0.0 0 1 2 WEEK Figure 2. Performance of the exaggerated-use protocol during moist ambient weather conditions. Average dryness grades for two bar soap formulations (an irritating control and a mild control) are shown from Study 4, when the average dew point was 48øF in Week 1 and 50øF in Week 2.
Purchased for the exclusive use of nofirst nolast (unknown)
From: SCC Media Library & Resource Center (library.scconline.org)