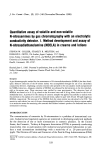
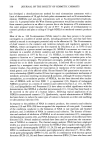
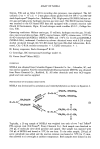
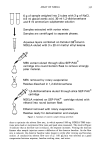
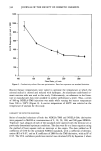
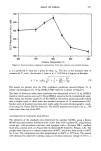
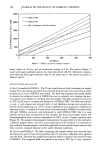
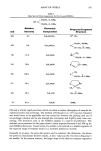
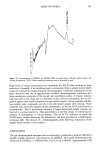
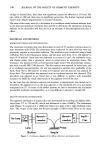
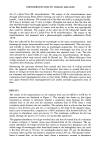
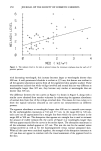
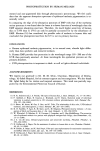
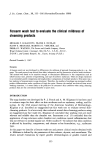
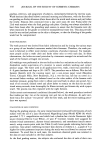
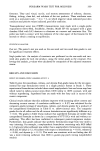
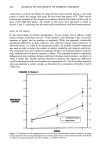
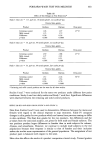
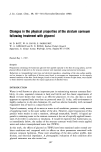
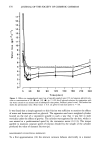
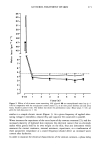
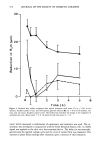
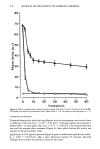
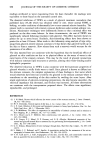
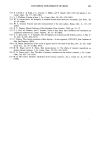
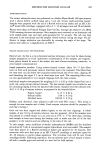
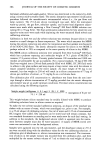
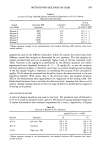
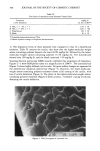
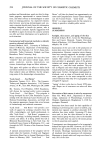
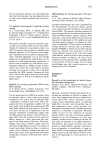
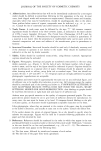
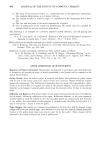
ASSAY OF NDELA 3 3 5 6 g of sample weighed into 2 tubes with 3 g of NaCI, 0.5 ml glacial acetic acid, 30 ml 1,2-dichloroethane and 9 ml ammonium sulphamate solution Samples extracted with vortex mixer. Samples are centrifuged to separate phases. Aqueous layers combined on ExtrelutketoneQE•olethylmethyl NDELA eluted with 3 x 20 ml •M•K extract eluted through silica SEP-P© cartridge into round bottom flask to removestron polar material. MEK removed by rotary evaporation Residue dissolved in 1,2-dichloroethane j 1,2-dichloroethane eluted through silica SEP-PAK © cartridge NDELA retained on SEP-PAK © cartridge eluted with ethanol into round bottom flask Ethanol removed with rotary evaporation. Residue ready for derivatization and analysis Figure 2. Summary of cosmetic sample cleanup procedure. done to optimize the solvent flow rate, in which repeated 100-ng NDELA-TMS injec- tions were made at incremental flow rates and peak areas measured. The results (Figure 3) indicate that as the flow rate is reduced, the response increases. Venting the reaction furnace after sample injection causes a deflection of the detector baseline. As the flow rate is reduced, the detector baseline takes longer to settle after venting and becomes noisier. A conductivity solvent flow rate of ca. 160 p.L/min was selected as a good compromise between response, baseline settling time, and noise.

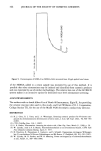
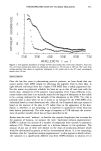
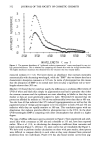
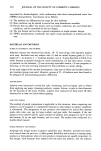
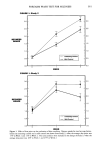
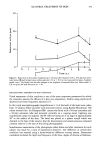
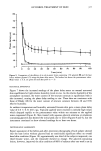
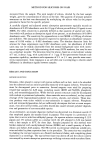
336 JOURNAL OF THE SOCIETY OF COSMETIC CHEMISTS 1200 1000- 800- 400- 200 - 100 - 0 I I I I 100 150 200 2•0 300 Flow Rate: # L/min Figure 3. Conductivity solvent flow rate optimization. Error bars represent one standard deviation. Reactor furnace temperatures were varied to optimize the temperature at which the nitrosyl radical is cleaved and reduced with hydrogen. An aluminum oxide-based ce- ramic reaction tube was used in this study. Unfortunately, no references in the litera- ture or manufacturer data were available to predict performance a priori. Thus, a series of 100-ng NDELA-TMS injections was made while varying the reactor temperature from 500 to 700øC (Figure 4). A reactor temperature of 600øC was selected as the temperature of analysis for this study. LINEARITY OF DETECTOR RESPONSE Series of standard solutions of both the NDELA-TMS and NDELA-OAc derivatives were prepared in MeOH at concentrations of 2, 10, 50, 100, and 500 ppm NDELA. Triplicate 1-•L aliquots of each of the standards were injected with the detector set at previously determined optimum conditions. The data were fit to a linear equation using the method of least squares with an intercept at the origin. The data yielded an X coefficient of 4150 for the acetylated NDELA standaMs, with a coefficient of determi- nation (R 2) of 0.97, and an X coefficient of 2880 for the TMS derivative, with an R 2 of 0.95. The 95% confidence prediction interval was calculated (45) by Equation 3 where
Purchased for the exclusive use of nofirst nolast (unknown)
From: SCC Media Library & Resource Center (library.scconline.org)