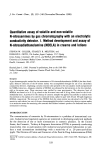
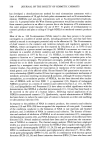
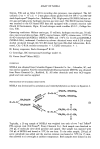
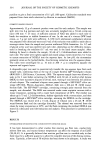
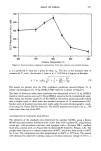
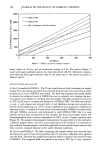
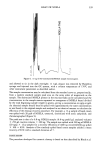
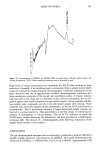
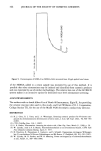
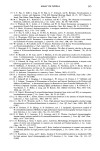
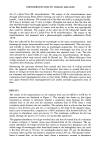
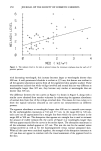
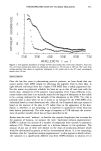
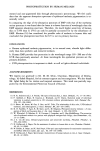
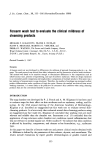
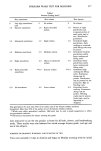
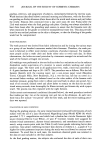
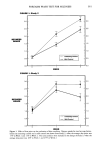
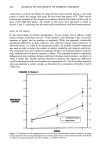
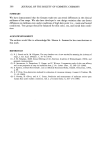
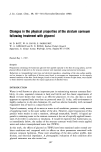
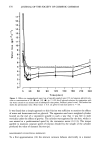
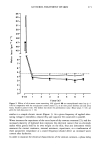
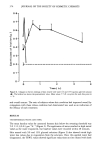
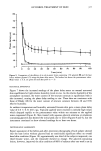
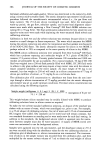
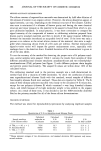
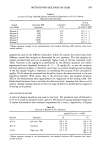
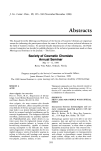
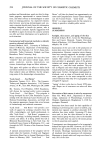
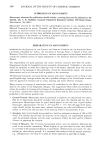
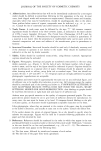
ASSAY OF NDELA 337 550 450" 400- 350- 300 I I I I 50O 550 6OO 650 7OO Furnace Temperature øC Figure 4. Reaction furnace temperature optimization. Error bars represent one standard deviation. Yc is a predicted Y value for a given X value, Xp. The Sy:x is the standard error of estimate for Y, and t, the Student t value at ot = 0.05 for n-2 degrees of freedom. y, _ t(•_a/2)Sylx J'l + 1 + (xp -- .•)2 • '5',(xi- •)2 (3) The results are plotted with the 95% confidence prediction interval (Figure 5). A sample chromatogram of a 10-ng NDELA-TMS injection is shown in Figure 6. The limit of detection under these conditions was determined to be 0.25 ng NDELA eluted as the his-acetate ester and 0.38 ng NDELA eluted as the bis-trimethylsilyl ester, these being the absolute quantities of the NDELA derivatives producing peaks which have a height equal to three times the standard deviation of 16 measurements (46). Similar series of standard injections were made under the same chromatographic condi- tions using the Varian FID for detection. The ELCD response was found to be ca. 250 times more than that of the FID. CONFIRMATION OF STANDARDS: MASS SPECTRA The identities of the standards were determined by capillary GC/MS, using a Kratos MS-80 mass spectrometer interfaced with a Carlo Erba 4160 capillary GC using helium carrier gas, cold on-column injection, and equipped with a 30-meter DB-5 capillary fused silica column with a 0.25-1xm film thickness (J&W Scientific, Folsom, CA). The samples were injected at a column temperature of 60øC, which was then raised to 100øC for 3 min. The temperature was then programmed to 260øC at 10øC/min. The spectra were obtained by repetitive scanning using an electron ionization voltage of 50 ev, a

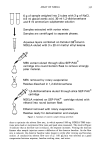
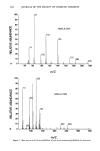
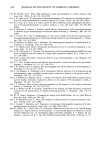
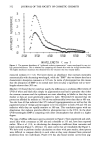
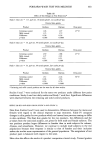
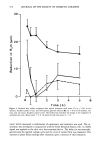
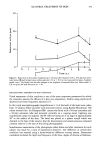
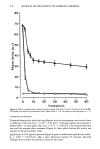
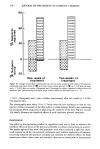
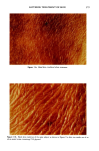
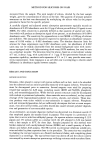
338 JOURNAL OF THE SOCIETY OF COSMETIC CHEMISTS 2500 2000- 1500 - 000- 500- •"• NDELA-TMS • .... ___•' •5Do/iLcA•f•d• rice Limits Error Ba rids •.''''' •5 i i I I 0 100 200 300 400 500 ng NDELA Figure 5. NDELA derivatives standard response. beam current of 150 •a, and an acceleration voltage of 4 kv. The spectra (Figure 7) match previously published spectra for these derivatives (26,35). Elemental composi- tions obtained from high-resolution data on the major ions in the spectra are given in Tables I and II. DERIVATIZATION AND ANALYSIS A) Bis-(O-trimethylsilyl)NDELA. The 50-mL round-bottom flask containing the sample residue from the cleanup procedure was removed from the desiccator and 125 •L of dry pyridine and 125 •L of BSTFA were added. The flask was stoppered and gently shaken to dissolve the extracted traces of NDELA but not so violently as to disperse the reac- tion mixture into droplets on the flask wall and stopper. The flask was placed in an oven at 70øC for 60 min to complete the formation of NDELA-TMS. The flask was allowed to cool, a 1-•L aliquot was removed with a 1-•L Hamilton syringe and injected into the GC system operating at a 145øC column temperature and instrument conditions as described earlier. A sample of a hand lotion with undetectable NDELA was spiked with 100 ppb NDELA, extracted, and derivatized to yield NDELA-TMS. Due to a long baseline settling time encountered in this analysis, the derivatized sample extract was chromatographed with a column temperature of 130øC to give a longer retention time (Figure 8). This sample chromatogram demonstrates the applicability of the method to a different sample matrix. For the accurate application of the method, it is necessary to first establish chromatographic conditions applicable to anticipated sample matrices and then construct standard response curves under identical conditions. 13) 13is-(O-acetyl)NDELA. The flask containing the sample residue was removed from the desiccator, and 125 •L of dry pyridine and 125 •L acetic anhydride were pipetted into the flask. The flask was stoppered and gently shaken to dissolve the extracted traces of NDELA. The stoppered flask was placed in an oven at 70øC for 15 min, removed,
Purchased for the exclusive use of nofirst nolast (unknown)
From: SCC Media Library & Resource Center (library.scconline.org)