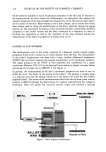
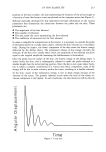
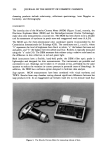
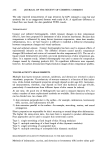
SEGREGATION OF SOLIDS BY VIBRATION 225 cylinder was disassembled, and the granulation in each segment was separated by screening and each size weighed. The extent of bed segregation at time t can be described by equation (1): s = {Z[fi(ix- xi)2]/n} I/2 (Eq. 1) where S is the standard deviation of the system, fi is the weight of the i sample, X i is the weight fraction in the i sample of the 14/16-size (larger) particles, !x is the weight fraction in the system of the 14/16-size particles (0.5 in all cases), and n is the total weight of the system. It is important to note that the standard deviation shows only the extent of segregation that has occurred and not the nature of segregation within the various regions of the bed. Each particle bed composition/amplitude combination stud- ied was examined for its segregation characteristics at various time intervals until no further increase in the standard deviation of segregation was observed. Electronic data on monodisperse beds was obtained for the dielectric properties of the bed by a capacitor. The capacitance circuit used and the methods of processing signals from this circuit have been described previously (2). This relationship between bed density and capacitance is expressed in equation 2, in which the modulation in the FM signal, m(t), is produced by changes in the capacitance, C, of the particulate bed: t m(t)dt •- -(2?rK/ot) •t_ ACdt o• o• (Eq. 2) K and ot are proportionality constants that have different mathematical origins. Changes in the vibrated beds were monitored by a parallel plate capacitor that was affixed to the cylinder. The capacitor was centered at a height of 6.3 cm above the bottom of the bed, whose total depth was 10.0 cm. It was connected in parallel to the carrier oscillator of an FM transmitter (Model 1G-37 FM stereo generator, Heath Co.). Capacitance changes in the oscillating circuit of the transmitter result in a frequency modulated signal, which when demodulated by an FM receiver (Model AR-27 FM solid-state receiver, Heath Co.) and displayed on an oscilloscope (Type 547, Tektronix, Inc.), give a trace whose amplitude is opposite in sign and proportional to the capac- itance change. A magnetic pickup attached to the flywheel of the shaker triggered the oscilloscope at a known time and phase angle in each shaking cycle. Adjustment of the sweep rate of the oscilloscope to equal the time needed for one cycle of the shaker allowed capacitance changes to be known as a function of the phase angle of the cycle. The capacitance of a capacitor is directly proportional to the relative permittivity of the dielectric material between the plates. When electrically conducting particles are in- troduced between the capacitors' plates, its capacitance increases because the conducting particles have a higher dielectric constant than the air that they replace. It is important to realize that a change in capacitance due to the bed may result from a change in the bulk density of the bed or a change in the configuration of the particles between the plates, or both (3). The predominant factor causing an increase of capacitance due solely to particle configuration is an increase in the number of interparticulate contacts. Groups of particles in contact are seen by the capacitor as single large particles. A single large particle allows for greater polarization than an equal volume of smaller particles and thus has an effectively larger dielectric constant. Therefore, an increase in capaci- tance will be due mainly to either an increase in the number and volume of particles

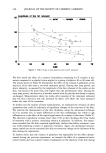
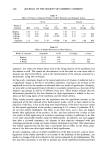
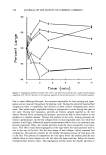
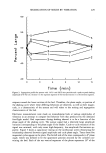
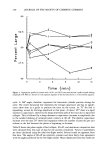
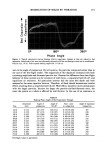
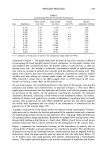
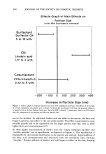
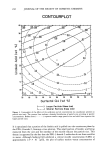
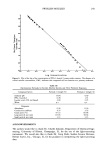
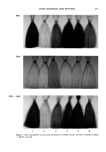
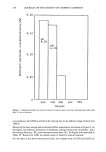
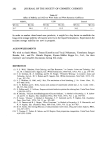
226 JOURNAL OF THE SOCIETY OF COSMETIC CHEMISTS between the plates, or an increase in the number of interparticulate contacts, or some combination of these factors. RESULTS AND DISCUSSION Data for the segregation studies of binary mixtures are presented in Table I and Figures 1-4. Table I shows the maximum standard deviation obtained from each system stud- ied. Figures 1-4 indicate the percent by weight of large particles of each section of the bed of a given system as a function of time. Bed sections are consecutively numbered one through six, with section one at the bottom and section six at the top of the bed. Table I shows that maximum bed segregation decreases as amplitude increases and/or particle size difference decreases. Figures 1-4 show that the qualitative nature of seg- regation of the 14/16-20/25 system is fundamentally altered within the sections of the bed as the amplitude increases. Sections 1 and 2 of the bed are uninvolved in the segregation process at the 0.254-cm amplitude, since their percent of large particles remains relatively constant at about 50%. Of the top four "active" sections, the smaller particles migrate downward, as indicated by the increasing percentage of large particles in sections 5 and 6 and the decreasing percent of large particles in sections 3 and 4. As the amplitude is increased to 0.358 and 0.442 cm, the bed segregation characteristics clearly change. Initially, the entire bed becomes involved in the segregation process, and secondly, certain sections of the bed "invert," that is, between two or more sections, the smaller particles migrate upward. In general, section 5 becomes the richest in large particles, and section 6 contains more small particles than section 5 and often section 4. At the highest amplitude of 0.508 cm, the system undergoes a full segregation inversion of all sections, although the degree of the segregation is relatively small. Qualitative behavior of the 14/16-18/20 and 14/16-25/30 systems as a function of increasing amplitude is similar. The difference is that the 14/16-18/20 system tends to invert at lower amplitudes than the 14/16-20/25 system, while the 14/16-25/30 system is least prone to inversion. The concept of an idealized free-flight trajectory of particles subjected to vertical sinu- soidal motion is useful in considering the motion of the particles within the bed. This model assumes negligible wall friction, a shallow bed that can move as a whole, and Table I Maximum Segregation Values of Binary Systems Amplitude (cm) Particle sizes Sma x 0.254 14/16-25/30 0. 122 0.254 14/1 6-20/25 0. 083 0.254 14/16-!8/20 0.066 0.358 14/16-25/30 0.152 0.358 14/16-20/25 0. 070 0.358 14/16-18/20 0. 040 0.442 14/16-25/30 0. 065 0.442 14/1 6-20/25 0. 034 0. 508 14/16-25/30 0. 075 0.508 14/16-20/25 0.025 0. 508 14/1 6-18/20 0.014
Purchased for the exclusive use of nofirst nolast (unknown)
From: SCC Media Library & Resource Center (library.scconline.org)