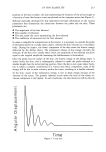
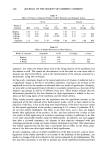
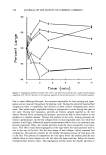
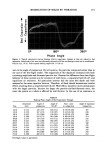
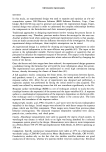
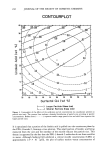
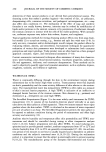
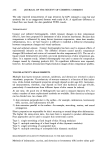
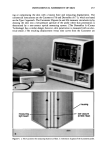
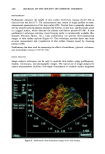
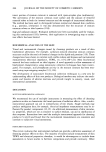
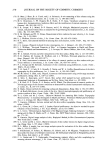
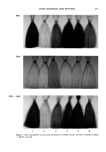
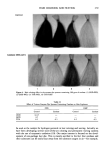
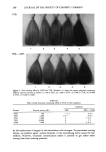
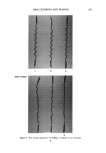
SEGREGATION OF SOLIDS BY VIBRATION 229 60 - 55 50 45 40 6 - 1 1 2 2 3 6 9 12 15 Time (rain) Figure 3. Segregation profile for system with 14/16- and 20/25-size particles and a peak-to-peak shaking amplitude of 0.442 cm. Section 6 is the topmost segment of the bed and section 1 is the bottom segment. migrate toward the lower sections of the bed. Therefore, the phase angle, or portion of the shaking cycle where these differing behaviors are observed, as well as their magni- tude, is a characteristic of the system and will relate to the mixing and segregation characteristics of the bed. Electronic measurements were made on monodisperse beds at various amplitudes of vibration in an attempt to compare bed behavior with that predicted by the idealized free-flight model. Bed capacitance during shaking showed it to be a function of the phase angle of the shaking cycle. The output signal had a relatively large amplitude variation corresponding to the phase angle of the shaker. Cycle-to-cycle variation of the signal was minimal, with only some high-frequency, low-amplitude fluctuations ap- parent. Figure 5 shows a capacitance tracing on the oscilloscope screen illustrating the relationship observed between signal amplitude and cycle phase angle. Traces from five sequential cycles appear in the plots. The far left side of the trace corresponds to 0 ø phase angle, which was defined to be the uppermost position attained by the cylinder con- taining the bed. Each of the ten vertical segments of the photo represents 36 ø of the

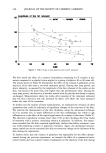
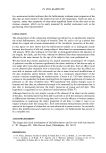
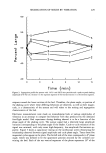
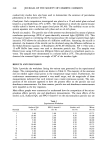
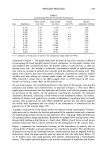
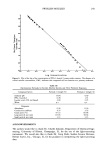
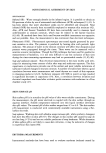
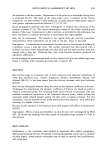
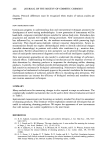
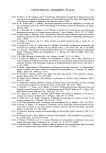
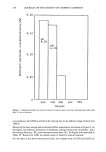
230 JOURNAL OF THE SOCIETY OF COSMETIC CHEMISTS 55 50 47.5 0 3 6 9 12 15 Time (rain) Figure 4. Segregation profile for system with 14/16- and 20/25-size particles and a peak-to-peak shaking amplitude of 0. 508 cm. Section 6 is the topmost segment of the bed and section 1 is the bottom segment. cycle. A 180 ø angle, therefore, represents the lowermost cylinder position during the cycle. The center horizontal line represents the average capacitance and has no signifi- cance other than as a guide to position the trace on the screen. At 70 ø the bed is expanding, as seen by the large amplitude at that point. At about 187 ø there is a rapid increase in capacitance, shown by the sharp downward path of the trace due to rapid bed collapse. This is followed by a sharp decrease in capacitance (increase in amplitude) due to the sudden breaking of interparticulate contacts at lift-off. The shallow capacitance decrease over the next 20 ø shows bed expansion where the number of particles per unit volume in the bed between the plates is beginning to decrease. Table II shows the phase angles of bed collapse, lift-off, and maximum compaction that were obtained from this type of data for the systems considered. Values in parenthesis are those calculated using the ideal free-flight model. Several trends are apparent from this data. The angles of lift-off are relatively constant and show fairly close agreement with the angles predicted by the free-flight model. Major departures from this model are
Purchased for the exclusive use of nofirst nolast (unknown)
From: SCC Media Library & Resource Center (library.scconline.org)