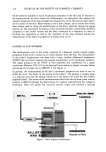
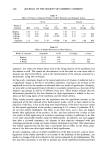
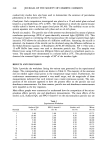
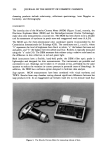
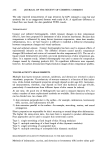
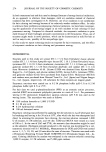
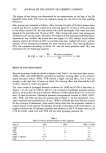
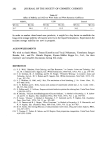
238 JOURNAL OF THE SOCIETY OF COSMETIC CHEMISTS conductivity studies have also been used to demonstrate the existence of percolation phenomena in the systems (29-34). Cloud point. Each composition investigated was placed in a 15-mL sealed glass vial and heated in a waterbath from 25øC to 96øC. The temperature at which the system became visibly turbid is known as the upper cloud point (45,46). The turbidity occurs as the system separates into a surfactant-rich phase and an oil-rich phase. Particle size analysis. The particle size of the systems was determined by means of photon correlation spectroscopy (PCS) of quasi-elastically scattered light (QUELS) (22). This technique is based on correlating the fluctuations about the average scattered laser-light intensity. PCS allows the calculation of a diffusion coefficient. Assuming the micelie is spherical, the diameter of the micelie can be calculated using the diffusion coefficient in the Stokes-Einstein equation. A Brookhaven 20/30 AT (Holtsville, NY 11742) with a 15-mW HeNe laser source was used to determine particle size. The samples were filtered twice using 0.45-micron Millipore filters and placed in cylindrical quartz cu- vettes. The samples were thermostated in a toluene bath at 25øC. The photomultiplier detected the scattered light to an angle of 90 ø of the incident light. RESULTS AND DISCUSSION Table I provides the worksheet listing the various runs generated by the experimental design. The corresponding results are shown in Table II. The majority of the mixtures did not exhibit upper cloud points in the temperature range tested. Furthermore, the conductance measurements spanned a very small range, and the magnitude of these measurements indicated that each mixture was a water-continuous system. The com- position of the mixtures appeared to have the greatest effect on the particle size and absorbance measurements. For these reasons, particle size and absorbance measurements were regarded as the key responses. Main effects graphs were constructed to understand how the composition of the micro- emulsion affects particle size and absorbance measurements. The main effects of the linoleic acid, Surfactol Q4, and PPG-3-buteth-5 on the microemulsion particle size are Table I Experimental Worksheet Surfactol Q4 PPG-3-buteth-5 Linoleic acid Water Formula (wt %) (wt %) (wt %) (wt %) 1 5.00 5.00 2.25 87.75 2 10.00 2.50 0.50 87.00 3 15.00 0.00 4.00 81.00 4 5.00 5.00 4.00 86.00 5 5.00 5.00 0.50 89.50 6 10.00 0.00 2.25 87.75 7 15.00 5.00 0.50 79.50 8 15.00 0.00 0.50 84.50 9 5.00 0.00 4.00 91.00 10 5.00 0.00 0.50 94.50 11 15.00 2.50 2.25 80.25 12 15.00 5.00 4.00 76.00

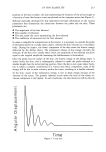
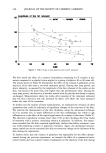
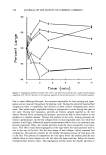
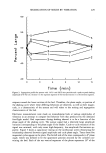
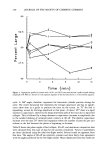
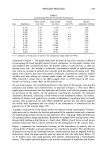
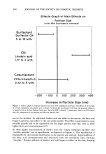
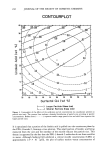
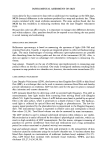
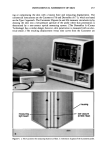
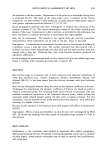
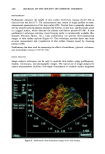
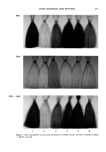
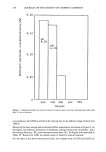
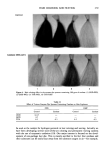
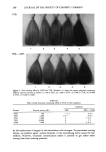
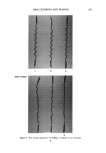
SWOLLEN MICELLES 239 Table II Corresponding Results of Generated Formulations Small micelie Large micelie Cloud* Specific Run Absorbance size (nm) size (nm) point (øC) conductance (mS/cm) 1 0.255 2.95 27.78 72.0 1.80 2 0.448 2.24 2.24 -- 3.46 3 0.660 3.01 114.04 -- 4.57 4 2.000 3.00 400.00 22.5 1.04 5 0.255 2.22 20.74 46.0 1.90 6 0.416 3.70 34.46 62.5 3.60 7 0.718 3.07 3.07 -- 4.89 8 0.578 2.88 2.88 -- 5.10 9 2.000 3.00 350.00 -- 1.26 10 0.243 2.00 2.00 -- 2.01 11 0.647 3.24 40.85 -- 4.38 12 0.681 3.79 85.61 -- 4.35 * (--) indicates no cloud point occurred in the temperature range tested (25-96øC). illustrated in Figure 1. The graph shows how the particle size of the micelies is affected by increasing the levels (weight percent) of each component. In this graph, linoleic acid and Surfactol Q4 concentrations have the greatest impact on particle size, as they are farthest from zero. An increase in surfactant concentration results in smaller particle size, while an increase in particle size coincides with the addition of linoleic acid. This agrees with theories that state that greater surfactant concentration produces smaller micelles and that adding an internal phase causes the micelie to swell (39). Since PPG-3-buteth-5 crosses zero in the effects graph, there is a 95% chance of the cosur- factant not having a main effect on the particle size. As one would expect, the contributing factors to the clarity of the system were also the surfactant and linoleic acid concentrations, as depicted in Figure 2. This main effects graph again demonstrates that the surfactant and linoleic acid have the greatest impact on the clarity of the system. As the surfactant concentration increased, the measured absorbance decreased, indicating a trend toward a more transparent system. In contrast, addition of linoleic acid produced an increase in absorbance, signifying hazy-to-cloudy systems. The similarity of the main effects graphs for particle size and clarity supports the widely held hypothesis that the clarity of the formulation is determined by the particle size of the internal phase (39). A graphic visualization of the design results was depicted using contourplots. Contour- plots were used to visualize the location and spread of the response values and to examine the relationships between the factors and responses. This "mapping" helps identify areas for optimal product design parameters. Responses are mapped over varying ratios of two factors while holding a third factor at a fixed value. Effects of each factor as well as any possible interaction effects will be indicated by the arrangement of the contour lines. Figure 3 represents the contourplot focusing on the dependence of particle size on various levels of linoleic acid and surfactant (no cosurfactant present). The distribution of particle sizes was fit by a bimodal function. Smaller particle sizes are mapped with the dotted line, while the larger particle sizes are depicted with the solid lines. Below 1.0 wt % linoleic acid, only small particles were present, demonstrating a monodisperse system. The smaller particles appear to be micelies comprised of surfactant and linoleic
Purchased for the exclusive use of nofirst nolast (unknown)
From: SCC Media Library & Resource Center (library.scconline.org)