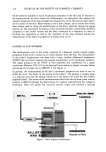
236 JOURNAL OF THE SOCIETY OF COSMETIC CHEMISTS The microstructure of microemulsions has been investigated extensively in an attempt to classify these unique systems. Like macroemulsions, microemulsions may be of the oil-dispersed-in-water type or the water-dispersed-in-oil type, depending on the relative proportions of oil and water in the system (9). Water-in-oil microemulsions (w/o) have been found to be much easier to prepare than oil-in-water microemulsions (o/w) (2). Under certain conditions of temperature and composition, microemulsions may also exhibit a bicontinuous, "sponge-like," structure (10,11). Regardless of the microstructure, the formation of microemulsions is a highly specific process. This specificity is based on their almost spontaneous formation (12). Therefore, unlike conventional emulsions, microemulsion systems require little mechanical energy input. Their spontaneous formation is a direct result of microemulsion thermodynamic stability. Several investigations have been conducted that focus on the thermodynamic or kinetic aspects of microemulsions (13-17). However, the stability and formation of microemulsions have yet to be completely understood. It is generally accepted that a reduction of the interfacial tension by several orders of magnitude must occur in order for spontaneous formation to occur (12). Other factors have also been noted that may be critical in promoting microemulsion stability (12, 17). The general components of a microemulsion are a primary surfactant, an aqueous phase, an oil phase, and in most cases, a cosurfactant. In general, microemulsions require a high concentration of surfactant relative to the dispersed phase. Therefore, if the product is a personal care product, it is very important to minimize the amount of surfactant to avoid high cost, minimize irritation potential, and improve the efficacy and aesthetics of the product. Excessive amounts of surfactant may also cause stickiness, excessive foam, alteration of fragrance, and/or discoloration (8). Medium-chain-length alcohols are typically used as cosurfactants (1). Obviously, other cosurfactants must be considered for cosmetic and pharmaceutical applications due to the high irritation potential of these alcohols. Other possible cosurfactants being investigated include glycol derivatives, lanolin derivatives, amines, cholesterol, and nonionic surfactant (12, 18-21). Several physical techniques can be employed in the characterization of microemulsions. Some techniques include light-scattering spectroscopy (22-26), fluorescence spectros- copy (27,28), conductivity (29-34), ultracentrifugation (35), nuclear magnetic reso- nance (36), phase diagrams (1,37-39), and electron microscopy (26,40). Each technique adds to the understanding of the microstructure of the microemulsion system. The characterization of microemulsions requires the use of several of these techniques rather than only one method. MATERIALS AND METHODS MATERIALS A quaternary ammonium cationic surfactant, ricinoleamidopropyl dimethyl ethyl am- monium ethyl sulfate (Surfactol Q4) was used as the primary emulsifier as supplied by Caschem (Palatine, IL 60067). The oil phase used was a mixture containing 65% linoleic acid blended with other saturated and unsaturated fatty acids supplied by Barnett Products, Inc. (Patterson, NJ 07504). PPG-3-buteth-5 (UCON-50-HB-100), supplied by Union Carbide (Edison, NJ 08818-4051) was considered as a possible cosurfactant. Deionized water was used as the continuous phase.

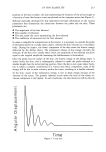
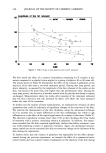
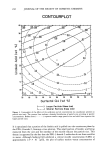
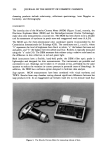
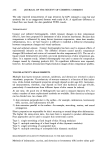
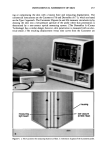
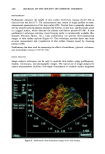
SWOLLEN MICELLES 2 3 7 METHODS In this study, an experimental design was used to examine and optimize an o/w mi- croemulsion system. RS1/Discover Software (BBN Software Products, Corp., Cam- bridge, MA 02238) was used to generate and analyze the experimental design. Exper- imental design was utilized in order to understand the complex relationships between the components in the formulations and their measured properties. Traditional approaches to designing experiments involve varying the process factors in an unsystematic way. Therefore, previous results dictate the settings for the next run. Another problem faced when analyzing traditional experimental results is that assump- tions are made unconsciously that can influence the results of the investigation. By using experimental design techniques, these implicit assumptions can be tested. An experimental design is a method for choosing and organizing experiments in order to obtain critical information in the most efficient way possible (41). The input to the system is the independent variable. Factors (input) are qualities or quantities that are presumed to influence the responses (output) of the system. The output is the dependent variable. Responses are measurable quantities whose values are affected by changing the levels of the factors. Once the factors and their ranges have been selected, the experimental design generates a worksheet listing the formulas that will yield the most information about the system. The experimental runs generated are randomized to avoid high correlations among factors, thereby decreasing the chance of biased data (41). A full quadratic model, containing the linear terms, the interactions between factors, and quadratic terms (i.e., each factor squared), was the initial model used to fit the response surface (42). After the set of experiments was designed and performed, a regression analysis was performed by fitting the initial model to data acquired. The model was refined by removing terms that did not contribute significantly to the fit. Response surface methodology (RSM) is a set of techniques utilized to study the rela- tionships between the response(s) of the system and the input variables (43). A response surface is a mathematical representation of the response's dependence on the factors (44). One technique used in visualizing the response surface is the contour plot. The lines represent the boundaries of the response surface. Surfactol Q4, linoleic acid, PPG-3-buteth-5, and water were the factors (independent variables) in the design. Initial ranges were selected for each factor except the aqueous phase, which was the filler component. These ranges were chosen from previous phase behavior investigations. The measured responses (dependent variables) were clarity, particle size, conductivity, and cloud point. Clarity. Absorbance measurements were used to quantify the clarity of each system. A wavelength was chosen in which little or no light was being absorbed for a selected transparent system given by the design. Measurements were taken at room temperature on a Perkin-Elmer 559 UV-VIS spectrophotometer (Oak Brook, IL 60521) operating at 350 nm. Conductivity. Specific conductance measurements were taken at 25øC in a thermostated waterbath using a CDM 80 Conductivity Meter (Radiometer, Westlake, OH 44145). Conductivity studies rely on the fact that o/w swollen miceliar mixtures are good conductors of electricity, whereas w/o systems exhibit very low conductivity. Electrical
Purchased for the exclusive use of nofirst nolast (unknown)
From: SCC Media Library & Resource Center (library.scconline.org)