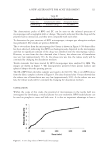
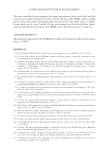
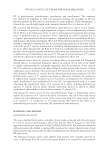
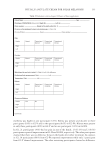
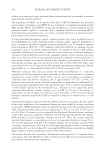
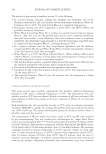
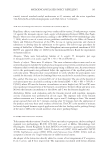
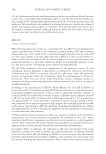
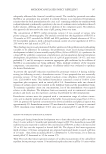
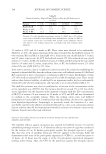
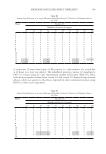
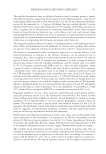
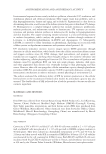
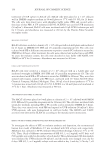
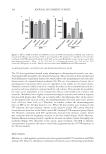
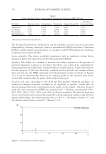
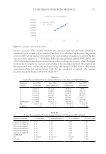
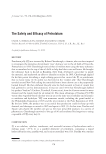
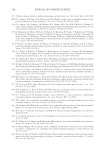
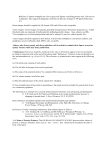
173 UV FILTERS IN SUNSCREEN PRODUCTS Recovery (accuracy). The closeness between the expected value and the value obtained is expressed by the accuracy of an analytical method. It is calculated by dividing the percent recovery (R%) of the analyte recovered by the total number of analytes recovered. In this case, successive analyses (n = 3) for three different concentrations spiked (80%, 100%, and 120%) of standard solution were carried out in order to evaluate the accuracy of the developed method. To investigate the recovery and validity of the developed method, the results from the experiment were statistically evaluated using the formula [% Recovery = (Recovered concentration/Injected concentration) 100]. To be considered acceptable, the average recovery should be between 90-110% (Table IV). Table III Method Precision Data From the Sample Solution of the Proposed HPLC Method Replicate number % octinoxate % benzophenone-3 % avobenzone % octocrylene Sunscreen sample A 6.65 5.49 2.49 1.62 Sunscreen sample B 6.42 5.49 2.51 1.6 Sunscreen sample C 6.37 5.44 2.41 1.61 Sunscreen sample D 6.39 5.29 2.55 1.55 Sunscreen sample E 6.31 5.26 2.54 1.55 Sunscreen sample F 6.35 5.34 2.49 1.58 AVERAGE 6.42 5.38 2.5 1.59 SD 0.120391 0.099227 0.0481 0.03 % RSD 1.87 1.84 1.92 1.91 Table II System Precision Data From the Standard Solution of the Proposed HPLC Method Replicate number Area STD octinoxate Area STD benzophenone-3 Area STD avobenzone Area STD octocrylene 1 1103415 632449 281941 799917 2 1091212 630491 294664 781772 3 1133370 645920 292924 819501 4 1123155 642783 284795 813077 5 1133241 648833 283581 820173 6 1116939 636718 280476 808599 AVERAGE 1116888.7 639532.3 286396.8 807173.2 SD 16847.16 7452.67 5938.95 14530.87 % RSD 1.51 1.17 2.0 1.80 y = 29845x - 49575 R² = 0.9951 0 50000 100000 150000 200000 250000 300000 350000 0 5 10 15 Average Area vs Concentration Figure 10. Linearity curve for avobenzone.

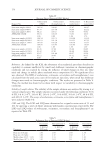
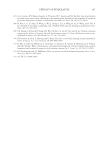
174 JOURNAL OF COSMETIC SCIENCE Robustness. As defined by the ICH, the robustness of an analytical procedure describes its capability to remain unaffected by small and deliberate variations in chromatographic conditions and was studied by testing the influence of small changes in flow rate (mL/ min) and change in mobile phase methanol:water composition (%). No significant effect was observed. The RSD of avobenzone, octinoxate, octocrylene and benzophenone-3 was calculated from the peak area count of five replicate injections, when small but deliberate changes were made to chromatographic conditions. The results are presented in Table V. Thus, the method was found to be robust with respect to variability in chromatographic conditions. Stability of sample solution. The stability of the sample solution was analyzed by storing it at various temperatures. The sample solution was stored under the following conditions: 0.6 h @ RT, 6 h @ 2–8°C, 24 h @ RT, 24 h @ 2–8°C, 30 h @ RT, 30 h @ 2–8°C, 48 h @ RT, and 48 h @ 2–8°C. The assays of avobenzone, octinoxate, octocrylene and benzophenone-3 were analyzed (Table VI). LOD and LOQ. The LOD and LOQ were determined at a signal-to-noise ratio of 3:1 and 10:1 by injecting a series of dilute solutions with known concentrations respectively. The LOD and LOQ values of avobenzone, octinoxate, octocrylene and benzophenone-3 are reported in Table VII. Table IV Recovery Data of Proposed HPLC Method Request No % Recovered (OMC) % Recovered (benzophenone-3) % Recovered (avobenzone) % Recovered (octocrylene) Sunscreen sample A 80% 101.16 108.91 97.07 100.97 Sunscreen sample B 80% 97.75 107.38 94.09 102.12 Sunscreen sample C 80% 98.22 109.17 93.65 99.61 AVERAGE %RSD 99.04 1.86 108.49 0.89 94.94 1.96 100.9 1.76 Sunscreen sample A 100% 104.54 103.71 104.98 111.19 Sunscreen sample B 100% 103.19 101.38 104.51 107.55 Sunscreen sample C 100% 107.05 105.28 108.39 111.47 AVERAGE %RSD 104.93 1.86 103.45 1.89 105.96 1.99 110.07 1.99 Sunscreen sample A 120% 92.26 97.90 85.98 89.85 Sunscreen sample B 120% 93.42 97.81 86.69 88.94 Sunscreen sample C 120% 93.67 101.44 89.27 92.26 AVERAGE %RSD 93.12 0.88 99.05 2.0 87.32 1.98 90.35 1.89 Table V Robustness Data of Proposed HPLC Method Octinoxate Benzophenone-3 Avobenzone Octocrylene Parameter % RSD of STD peak % RSD of assay % RSD of STD peak % RSD of assay Flow rate (0.6 mL) 1.93 1.69 1.69 1.59 Flow rate ( 0.8 mL) 1.84 1.47 1.82 1.5 Mobile phase (85.5 : 14.5) 1.94 1.13 1.9 1.94 Mobile phase ( 87.5 : 12.5) 1.91 1.63 1.8 1.81
Purchased for the exclusive use of nofirst nolast (unknown)
From: SCC Media Library & Resource Center (library.scconline.org)