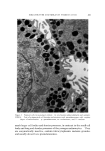
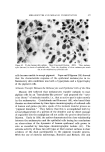
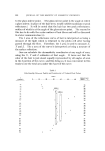
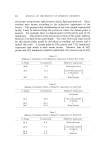
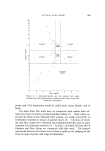
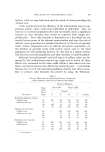
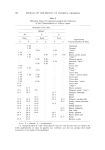
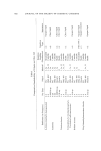
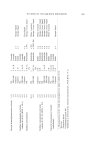
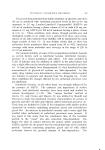
INFLUENCE OF ANTIBACTERIAL SOAP 619 lection, while no soap had been used for about 48 hours preceding the 72-hour test. Table I indicates that the efficiency of the antibacterial soap in sup- pressing axillary odors varies from individual to individual. Also, an increase in bacterial population does not necessarily cause a significant increase in odor intensity that would be expected from simple pro- portionality. Since odor intensity is dependent on a fractional but not exactly known power of the odorant concentration and since the rate of odorant vapor generation is a complex function of (a) the rate of apocrine sweat (whose components serve as odorant precursors) generation, (b) the dilution of apocrine sweat with eccrine sweat, and (c) the total population of odor-producing bacteria (6), the lack of a simple correla- tion between bacterial population and odor intensity is understandable. Although bacterial growth and both types of axillary odors are de- pressed by the antibacterial soap for any single test in which all these effects were measured on the same axilla within a time interval of two hours, correlation between the effects was relatively poor. Correlations between the level of the bacterial population density and either secon- dary or primary odor intensity was probed by using the Wilcoxon- Table I Relative Efficiencies of Antibacterial Soap in Depressing Axillary Bacteria and Odor of Different Individuals Relative Efficiency _ Hours Left Axilla Right Axilla after Subject Use of Parameter Soap P Z M U Average Bacterial population density Neutral soap Antibacterial soap Primary odor intensity Neutral soap Antibacl erial soap Secondary odor intensity Neutral soap Antibacterial 24 100 100 100 100 100 24 3 24 30 61 29 48 128 73 27 132 90 72 25 270 104 114 128 24 • 100 100 100 100 24 51 34 50 45 48 17 57 47 40 72 29 57 91 59 24 100 100 100 100 100 24 83 72 65 85 78 48 80 78 45 75 70 72 144 100 90 50 96 Not measured.

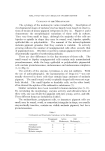
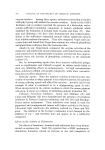
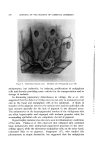
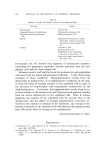
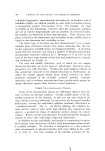
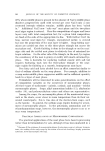
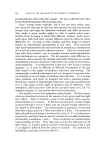
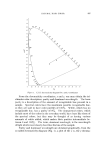
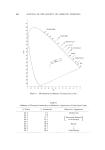
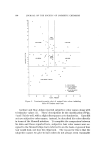
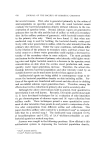
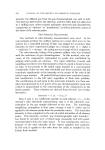
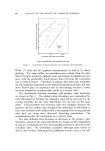
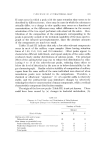
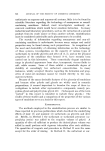
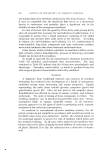
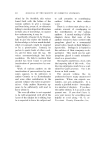
620 JOURNAL OF THE SOCIETY OF COSMETIC CHEMISTS // / ,, ,, / x / x / / / o / / o Subjects oM oZ 1,0 2 o0 Normalized Odor Intensities From Axillee (Lines Are Visual Guides Rather Than Statistically Derived Curves) Figure 3. Correlations between primary and secondary odor intensities White (7) rank test for unpaired measurements as well as by direct plotting. For some axillae, no correlation was evident from the plot. When the plots seemed to indicate some correlation, its significance was poor, with the probability much greater than 0.0,5 that the correlation was a result of chance. Therefore, it appears that both odor intensities are only partially dependent on the bacterial population density and that other factors play an important role in determining whether a lower bacterial population automatically results in a weaker odor. The correlations between secondary and primary odor intensities are shown in Fig. 3. The primary odor intensities were normalized for each individual by dividing the intensity observed in each test by the average intensity for the same individual over all tests on the same axilla. This procedure was necessary since the coupling between the garment and the axillary skin changes from individual to individual so that cases in which weak axillary odor is accompanied by strong garment odor and vice versa were observed, distorting correlations. The normalization puts the correlations on a relative basis. The plot indicates that increases or decreases in the primary odor intensities caused in the same individuals by changes in the composition of soap are accompanied by the corresponding increase or decrease of the secondary odor. The correlation is positive although some scatter of data is also evident, indicating that additional factors, such as the effi-
Purchased for the exclusive use of nofirst nolast (unknown)
From: SCC Media Library & Resource Center (library.scconline.org)