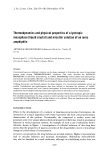
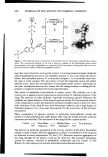
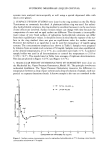
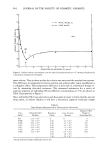
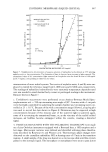
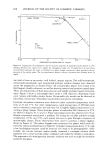
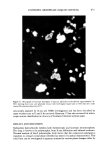
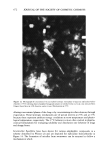
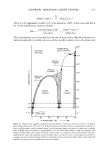
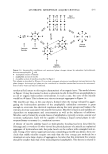
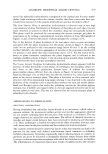
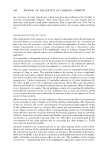
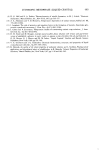
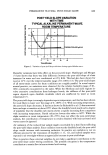
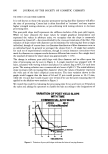
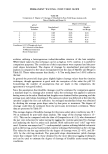
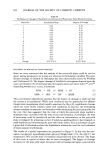
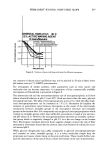
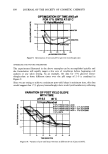
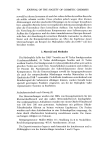
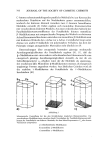
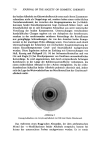
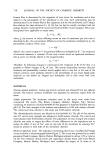
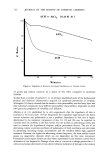
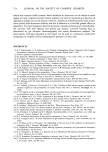
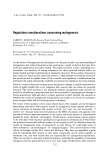
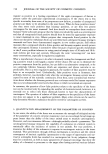
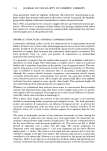
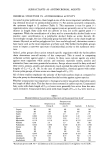
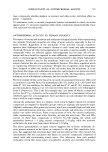
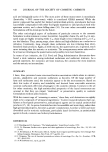
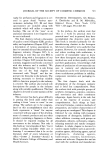
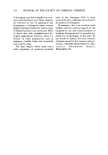
LYOTROPIC MESOPHASE (LIQUID CRYSTAL) 667 IOOO • I / - 3000 o // 900r © NEPHELOS UNITS A (O-IOO0) / - 2700 800 I'-- o NEPHELOS UNITS B //o ( 0 - 3000) 2400 -- 700 -- i /o 2100 • 600 -1800 u3 500 - 1500 o a_ 400 LU -- 1200 ,,, z z - 900 200 P' -• •== - 600 I00 - 300 01 -- I00 I BA I 0.01 0.1 1.0 I0.0 CONCENTRATION NAFOXIDINE HCI (mg/ml) Figure 7. Nephelometric determination of aqueous solution of nafoxidine hydrochloride at 25øC plotting nephelos units vs. log concentration. The formation of haze is observed as an increase in light scattered. The extrapolated value of 0% transmission (light scattered) at 0 nephelos units for A and B units is 0.68 mg/ml and 0.75 mg/ml, corresponding to observed cmc values. measurement of more turbid systems. Two series of nephelos units, A and B, were em- ployed to extend the reference range from 0-1000 units and 0-3000 units, respectively. The readings of nafoxidine hydrochloride were extremely temperature dependent and care was needed to avoid thermal body contact or prolonged reading in the instrument. Data are shown in Figure 7. c. Turbidimetric measurements were performed on an Aminco-Bowman Model Spec- trophotometer at k = 700 m/x measuring at an angle of 90 ø. Cuvettes with a 1-cm path were thermally controlled by jacketting the sample chamber and circulating water con- trolled at 25 +- 0. IøC. Because of the wide concentration range followed, a log-log plot was used to record the data shown in Figure 8. Deviations may be expected at high concentrations because of two reasons: part of the scattered light is scattered again, some of it re-entering the transmitted beam, or, as the viscosity of the turbid colloid increases, air bubbles become entrapped within the cuvette, creating a distorted signal. 5. PHASE EXAMINATIONS WITH THE POLARIZING MICROSCOPE were made on a Leitz Ortholux instrument equipped with a Bertrand lens, a 10X eyepiece and a hot stage. Microscopic textures were defined and identified utilizing phase classifica- tions described by Rosevear (3) and Winsor (2,4). Thermotropic phase changes were observed on the crystalline nafoxidine HC1 at heating rates of lø/min in the transition regions. A small sample of the drug was heated on a microscope slide until the crystals passed to the isotropic liquid. The mesophase or mesophases were seen to pass across

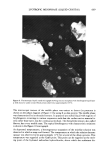
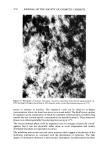
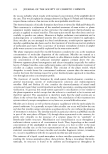
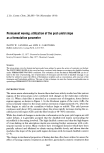
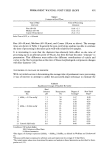
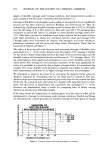
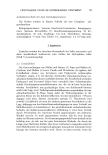
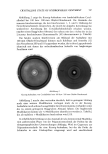
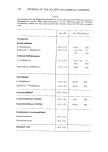
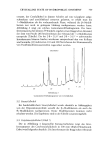
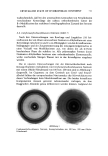
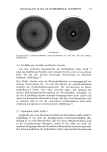
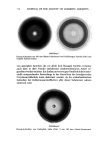
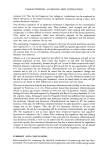
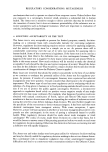
668 JOURNAL OF THE SOCIETY OF COSMETIC CHEMISTS 10o 1.0 l 0.1 0.001 o o o SINGLE SPECIES 25'C 90* 700 m/.z ø••1:• 1.55 mg/rnl I 50mg/ml /--% COACERVATE ' •' ø o MI I I I I 0.01 O, I I, 0 I0.0 I00.0 CONCENTRATION NAFOXIDINE HCI (mg/ml) Figure 8. Log-log plot of turbidimetric data for aqueous solutions of nafoxidine hydrochloride at 25øC showing observed cmc values at 0.7 mg/ml. An extrapolated value of 1.35 mg/ml for a second critical concentration represents the onset of turbidity for a phase change (coacervate) which represents the ap- pearance of the middle phase. The log turbidimetric behavior shows a departure from linearity above 30 rag/mi. the field of view as successive, well defined, opaque regions. The solid-mesomorph, mesomorph-mesomorph, and mesomorph-isotropic solution changes were observed across the preparation as distinct fronts. All mesomorphic phases were found to be birefringent (doubly refractive) as well as showing uniaxial and positive optical signs. These are characteristic of both neat (smectic) and middle (nematic) liquid crystal tex- tures. Figure 9 shows a micrograph taken under a 10X objective, displaying a focal conic texture with fanlike terrace fronts. Occasionally oily streaks can be observed in this turbid, viscous state. This phase was identified as a smectic mesophase. Lyotropic mesophase transitions were observed under controlled temperature condi- tions at 25 and 37øC. For other temperatures, rapid heating rates of 10øC/rain were used to minimize evaporation and may have led to slightly higher temperatures in re- cording a phase change. Three lyotropic phases of nafoxidine HC1 observed at 25øC are shown in Figures 10, 11 and 12. These same phases were also observed at 37øC al- though evaporation represented a problem. By drying the micellar solutions at high temperature (25øC) and 37øC, each system was seen to pass through a sequence of mesomorphic phases. These observations were used to construct a phase diagram, shown in Figure 13. This phase diagram was constructed for phases which were ob- served by various methods listed in Table III. At higher temperatures above 37øC, only a few birefringent textures could be detected (too weak to be photographed). Addi- tionally, the viscous isotropic region usually contained a conjugate solution which separated into a clear isotropic phase combined with either the middle or neat phase. The appearance of a homogeneous isotropic solutions was used to judge the transition points for this phase.
Purchased for the exclusive use of nofirst nolast (unknown)
From: SCC Media Library & Resource Center (library.scconline.org)