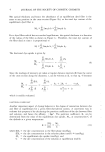
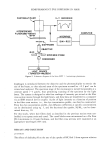
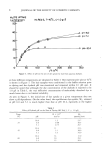
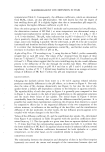
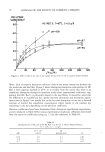
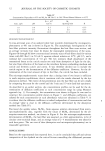
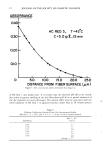
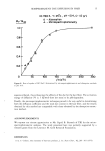
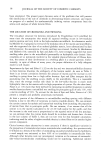
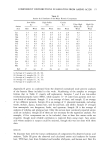
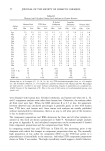
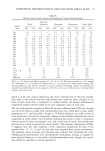
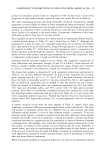
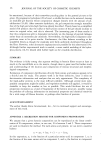
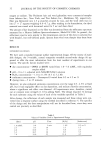
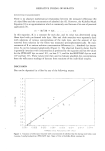
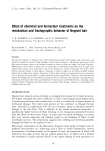
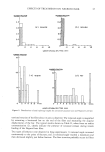
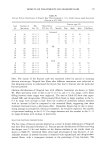
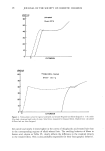
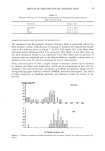
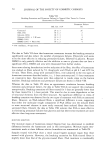
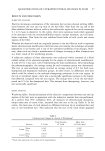
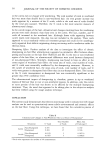
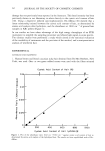
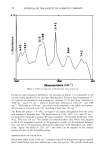
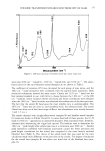
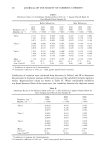
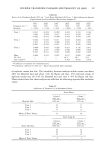
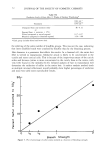
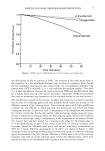
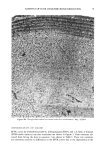
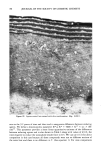
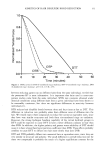
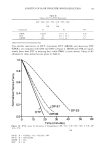
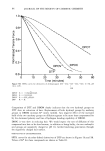
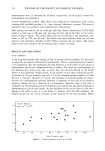
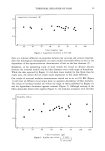
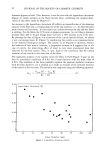
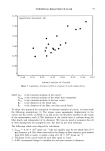
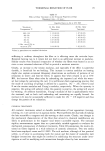
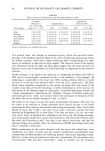
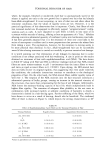
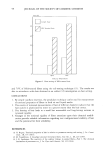
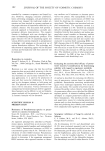
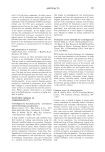
12 JOURNAL OF THE SOCIETY OF COSMETIC CHEMISTS Table IV Concentration Dependence of D and Mo, for HC Red 3 in 50% Water-Ethanol Mixture at 42øC D X 10 •ø Conc. (g/l) pH (cm2/s) (pomol/g hair) K 1.0 9.0 6.5 2.7 0.53 2.5 9.3 8.2 6.0 0.47 5.0 9.5 10.0 11.4 0.45 MICROSPECTROPHOTOMETRY A cross-sectional scan of an undyed white hair (control) determined by microspectro- photometry at 491 nm is shown in Figure 6a. The morphologic heterogeneity of the hair fiber produces intensity fluctuations throughout the hair fiber cross section, and an average intensity line must be drawn for meaningful interpretation of the scans. Figures 6b through 6d show cross-sectional intensity scans of hair fibers dyed for various times with HC Red 3 in 50 vol.% aqueous ethanol solution at 42øC, pH 9.5, and a nominal dye concentration of 5.0 g/1. The low intensity (high absorbance) of the transmitted beam at the cuticle results not only from absorption of light by the dye, but also from refraction of the beam at the interfaces between embedding medium and cuticle and between cuticle and cortex. It was therefore decided not to include the cuticle region in the determination of the diffusion coefficient. However, for the de- termination of the total amount of dye in the fiber, the cuticle has been included. The microspectrophotometric scans show that a dyeing time of two hours is sufficient to reach sorption equilibrium this is consistent with the results obtained by the dye absorption method. The extent of dye penetration into the hair fiber can be seen clearly by comparing the scans for the control and the 5-min and 15-min dyed hair specimens. As described in an earlier section, dye concentration profiles can be used for the de- termination of diffusion coefficients at each concentration range by using Matano's approach (eq. 3). For example, the transmission scan shown in Figure 6c was used to construct the concentration profile shown in Figure 7, and diffusion coefficients cal- culated for each concentration (at each absorbance value) are tabulated in Table V. It is evident that the diffusion coefficient is indeed independent of concentration and that its average value is close to the diffusion coefficient determined by the absorption method (see Table IV). Fractional dye uptake values, Mt/M•, from aqueous solution determined from micro- spectrophotometric data, together with the values of Mt/M• determined by the ab- sorption-extraction method, are shown in Figure 8. For the microspectrophotometric determination of Mt/M•, the hair fiber was assumed, as a first approximation, to be of circular cross-sectional shape, and an average value of 2-4 measurements was taken for each data point. The two sets of data (absorption and microspectrophotometry) are in reasonable agreement. CONCLUSIONS Based on the experimental data reported here, it can be concluded that pH and solvent composition of the dyebath are the critical factors controlling the diffusional processes

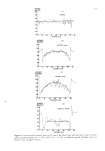
INTENSITY (Arb. Units) tOO 90 8C 70 60 50 40 30 (o) CONTROL DISTANCE (J•.m) 13 INTENSITY ( b ) (Arb. Units) 90 80 70 60 50 4C 343 INTENSITY (Arb. Units) 90 8O 70 60 5C 4O 30 HC RED 3, 5 rain DISTANCE (c) HC RED 3, 15rain I I I I I 20 :50 40 50 60 DISTANCE (d) ! INTENSITY (Arb. Units) 90- HC RED 5, I•0 rain 80- 40 so DISTANCE Figure 6. Cross-sectional intensity scans at 491 nm of hair fibers dyed with HC Red 3 from 50 vol.% aqueous ethanol dyebath at T = 42øC, pH 9.3, C = 5.0 g/l. (a) Undyed (control). (b) Dyed 5 min. (c) Dyed 15 min. (d) Dyed 120 min.
Purchased for the exclusive use of nofirst nolast (unknown)
From: SCC Media Library & Resource Center (library.scconline.org)