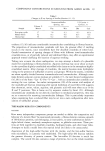
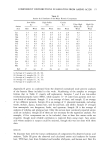
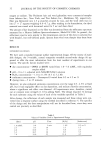
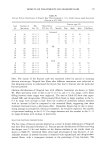
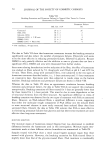
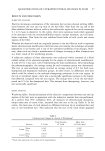
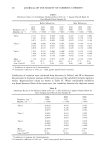
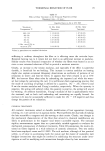
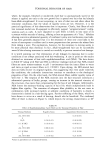
22 JOURNAL OF THE SOCIETY OF COSMETIC CHEMISTS Table III Observed and Calculated Amino Acid Analyses for Human Keratins X-linked Lameliar Human Hair TTD Hair Ichthyosis Ichthyosis Amino Acid Obs Calc Obs Calc Obs Calc Obs Calc Obs Calc Human Nail Lys 2.5 2.5 3.9 3.6 2.2 3.3 2.7 2.6 3.1 2.8 His .8 .8 1.0 .6 .5 .6 .6 .7 1.0 .8 Arg 6.2 6.1 6.2 7.2 4.2 5.5 5.9 7.0 6.5 6.7 Hcy 16.7 17.2 7.1 7.6 10.1 12.2 11.8 12.2 10.7 11.2 Asp 5.3 5.4 8.6 8.1 6.3 6.7 6.1 6.3 7.1 7.2 Thr 7.2 7.0 5.4 5.0 6. l 4.9 7.9 6.9 6.1 5.8 Ser 11.8 11.4 9.5 9.4 15.0 11.4 11.6 10.5 11.4 10.3 Glu 12.1 12.1 14.6 14.6 18.1 13.1 14.1 12.3 13.7 13.3 Pro 8.6 8.2 5.6 4.9 8.4 6.2 7.9 7.6 5.9 5.6 Gly 6.2 6.3 6.6 7.2 10.0 7.8 7.4 6.8 8.0 7.8 Ala 4.6 4.9 7.1 6.7 6.4 6.2 5.3 5.3 5.5 5.7 Val 5.8 5.6 6.6 6.1 1.8 6.5 5.7 5.8 4.2 5.5 lie 2.6 2.6 3.6 3.5 3.1 2.9 3.0 3.3 2.7 2.9 Leu 6. l 6.3 9.4 9.6 5.0 7.8 6.8 7.6 8.4 8.2 Tyr 1.9 2.1 2.5 3.4 1.5 2.8 1.3 3.0 3.2 3.7 Phe 1.6 1.5 2.2 2.5 1.4 2.1 1.8 2.2 2.5 2.5 % L 44 86 (57) (57) 69 % H + X 35 4 (0) (38) 12 % C 19 10 (38) (5) 8 % G 2 0 (5) (0) 11 RMS dev: 0.23 0.50 2.35 0.84 0.49 Human hair av. of 6 samples (27, 35, 38, 39, 40, 41) TTD (trichothiodystrophic hair), av. of 2 samples (27, 28) X-linked ichthyosis, av. of 3 samples (41) Lameliar ichthyosis (42) Human nail (40). Percentages are mole percent, rounded to one place without normalizing. Figures in parentheses are considered un- reliable because of the magnitude of R. Hcy ig the sum of half-cystine or S-carboxymethylcysteine, plus cysteic acid. were obtained with human hair, X-linked ichthyosis, and human nail when the L, H, and C component analyses were taken from human hair. Otherwise, the analyses taken all from wool were best. When the RMS deviation R is 0.5 or less, the agreement between observed and calculated percentages is generally good, as seen with human hair, TTD hair, and human nail. Since amino acid analyses are usually published without reproducibility information, there is no way to tell what part of the deviation is due to analytical error. The component proportions and RMS deviations for these and all other samples ex- amined in this work are shown summarized in Table V. Normalized sample analyses are given in Appendix II, and calculated compositions can be reconstructed if desired from component proportions and the compositions from Table I. In comparing normal hair and TTD hair in Table III, the interesting point is the sharpness with which the changes in component proportions show up. The unusually high proportion of low sulfur (L) component (86%) in the TTD hair points to a preponderance of micro fibrils in the structure. Individual TTD component proportions shown in Table V are similar. This high crystallinity would suggest a brittle behavior,

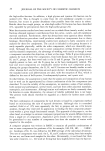
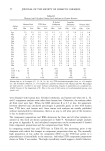
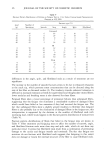
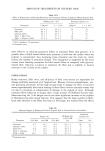
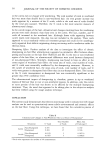
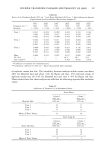
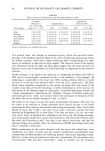
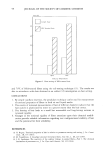
COMPONENT DISTRIBUTIONS IN KERATINS FROM AMINO ACIDS 23 Table IV Observed and Calculated Amino Acid Analyses for Various Animal Keratins Placental Wool Mammals Marsupials Monotremes Turkey Quill Amino Acid Obs Calc Obs Calc Obs Calc Obs Calc Obs Calc Lys 2.8 2.7 2.7 2.7 3.5 2.7 2.9 2.2 .7 2.6 His .8 .7 .9 .8 1.2 .8 .8 .8 .4 .8 Arg 7.1 7.0 6.8 6.9 5.9 6.2 5.8 5.7 4.0 5.6 Hcy 10.7 10.8 12.5 12.6 12.1 12.1 15.3 15.1 7.1 11.3 Asp 6.5 6.6 6.1 6.1 7.1 6.9 5.5 5.5 5.5 4.9 Thr 6.3 6.3 6.4 6.3 5.7 5.9 5.6 6.4 4.1 4.3 Ser 10.3 10.3 10.8 10.6 9.4 10.5 9.4 I 1.2 14.9 12.2 Glu 12.3 12.2 12.5 12.1 13.0 12.8 10.9 10.9 6.2 8.8 Pro 6.7 6.8 7.1 7.2 6.7 6.1 8.7 7.6 9.9 7.8 Gly 8.1 8.1 8.1 7.7 8.6 8.1 9.8 9.2 13.3 12.4 Ala 5.4 5.4 5.3 5.4 5.8 5.5 5.4 4.7 8.3 5.2 Val 5.7 5.6 5.4 5.4 5.2 5.8 5.6 5.6 7.5 5.7 Ile 3.2 3.2 3.0 3.0 3.1 2.8 2.1 2.4 3.1 2.3 Leu 7.7 7.9 7.0 7.4 7.4 7.9 6.5 6.5 9.1 7.0 Tyr 3.7 3.8 3.0 3.5 3.1 3.4 3.3 3.5 2.3 5.6 Phe 2.7 2.7 2.4 2.4 2.2 2.6 2.5 2.7 3.6 3.7 % L 62 57 62 4 l (27) % H + X 28 26 16 29 (0) % C 4 12 12 16 (13) % G 6 5 10 14 (22) RMS dev: 0.10 0.26 0.48 0.66 2.13 Wool, av. of 6 Lincoln and Merino samples (42, 43, 44, 45, 46) Placental mammals, av. of 11 samples (35) Marsupials, av. of 4 samples (35) Monotremes, av. of 2 samples (35) Turkey feather calamus (48). All percentages are mole percent, rounded to one place without normalizing. Figures in parentheses are considered unreliable because of the magnitude of R. Hcy is the sum of half-cystine or S-carboxymethyl cysteine, plus cysteic acid. which is in fact the clinical observation that led to identification of this hair disorder (28), since it was noticed that the easily broken hair could not reach a length on the head of much more than a centimeter. If verified further, the present mathematical component analysis method might be of some diagnostic value in such cases. The two ichthyosis hair samples in Table III are quite different from TTD hair, though the size of R tends to render their interpretation less clear. Both seem to have larger proportions of L, and less sulfur, though in X-linked ichthyosis the sulfur seems to come only from a cuticle-like component, whereas in the lamellar ichthyosis the cuticle component is nearly absent. The X-linked ichthyosis hair seems to have a component with an excess of serine and glutamic acid, and a deficiency of valine the lamellar hair variations are similar in general but much smaller. The summary information of Table V suggests from the close similarity of the component proportions for four of the samples (Nos. 11, 12, 13 and 14) that they may originate from similar mechanisms. The apparent excess of serine and threonine may indicate that intramolecular cross- linking greatly predominates over intermolecular crosslinking, leading to roughly the same physical behavior as a low sulfur (trichothiodystrophic) hair, though this conclu- sion should be regarded as entirely speculative.
Purchased for the exclusive use of nofirst nolast (unknown)
From: SCC Media Library & Resource Center (library.scconline.org)