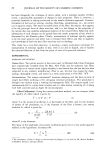
26 JOURNAL OF THE SOCIETY OF COSMETIC CHEMISTS be mentioned, because of their somewhat puzzling place in the general picture so far given. By progressive hydrolysis (20) of wool, a soluble fraction can be removed, leaving an insoluble gel fraction whose composition changes linearly with the amount of sol- ubilization (19,49). After extensive hydrolysis, the gel composition strongly resembles that of the high and ultra-high fractions already described. Theory based on a simplified model (50) predicts that the sulfur or half-cystine content of the gel should increase to twice its original value, and this is observed. The interesting part of these results is that this composition split is dependent exclusively on the cleavage of peptide linkages rather than on intermolecular crosslinks. Nevertheless, the high-sulfur component com- positions seem to be quite similar. Furthermore, the fiber behaves according to the simplified theory as though the crosslinks were fairly uniformly distributed throughout the fiber. However, other alternative explanations are possible for this observation (14). Although further experimental work is needed, a more careful modeling of the hydro- lysis process (14,51) should shed further light on the crosslink distribution. SUMMARY The evidence is fairly strong that aqueous swelling in keratin fibers occurs at least as much in the microfibrils as in the matrix, though there is great need for further study and understanding of the location and composition of various structural and morpho- logical components. Estimation of component distributions directly from amino acid analyses appears to be a fruitful area for study. The present work is far from definitive, since it relies on fractionation information and analyses that are only approximate. The complexity of the high-sulfur proteins is the most difficult problem. Although several more inde- pendent components might be added, and regression methods still applied, it would be desirable to keep the number as low as possible. This would facilitate the use of proportion estimation as a kind of fingerprint of the keratin structure, possibly easing the problem of collating information on mechanical properties and chemical reactivity for a wide range of fibrous keratins, or perhaps other families of proteins. ACKNOWLEDGEMENT The author thanks Zotos International, Inc., for its continued support and encourage- ment of this work. APPENDIX I: REGRESSION METHOD FOR COMPONENT PROPORTIONS We assume that a given keratin composition can be reproduced as the linear combi- nation of N components, where, in our case, N is between 2 and 5. Three components are used to illustrate the method. For each amino acid present, we can write a material balance x = ax• + bx2 + (1 - a - b) x 3 In this expression, x• is the fraction of a particular amino acid in component 1, x2 is the fraction of the same amino acid in component 2, and x 3 the fraction in component

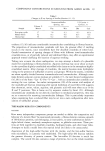
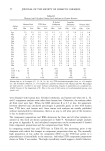
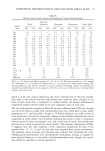
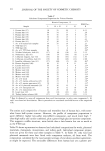
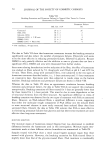
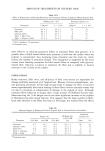
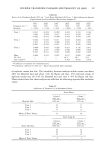
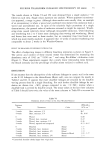
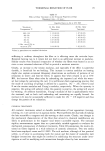
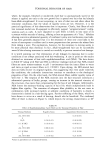
COMPONENT DISTRIBUTIONS IN KERATINS FROM AMINO ACIDS 27 3. These fractions are combined with a weight fraction, a, of component 1, b of component 2, and, since the fractions must total unity, a fraction 1 - a - b of component 3. This combination must equal the fraction x of the same amino acid in the original keratin. Since there are more amino acids than components, or should be, we define the statistical residual Re = • Ix - x 3 - a(x• - x 3) - b(x 2 - x0] 2 where the sum is taken over all the amino acids present. When all the weighting factors are properly chosen, this residual will be at a minimum. The position of this minimum is found by successively differentiating Re with respect to each of the weighting factors, setting each derivative to zero, and solving the resulting set of simultaneous equations. For the case of N = 3, two simultaneous equations must be solved: • (x -- x3)(Xl -- x 3) -- a • (x• -- x3) 2 -- b • (x• - x3)(x 2 -- x3) = 0 • (X -- X3)(X 2 -- X3) -- a • (x• -- x3)(x 2 -- x3) -- b • (x2 - x3) 2 = 0 Generalizing the method to any number of components is straightforward. Data for the component compositions is listed in Table II, and the keratin sample compositions used are listed in Appendix II. In the computation procedure, all com- binations of components were taken, 2, 3, 4, and all 5 at a time. The combination chosen had the minimum Re, with all coefficients positive. A component proportion produced by this method from input data in the form of mole fractions is actually a mole percent itself, and should strictly speaking be converted to a weight fraction. However, there is relatively little difference in the average molec- ular weight of most proteins, and so this conversion was not included in the present calculations. APPENDIX II: AMINO ACID COMPOSITIONS OF KERATIN SAMPLES Amino acid compositions for all samples listed in Table V are given in compressed form. Following the identification number from Table V in parentheses, normalized mole percents of the amino acids are listed in the following order: lys, his, arg, hcy, asp, thr, ser, glu, pro, gly, ala, val, ile, leu, tyr, and phe. (1) 2.72, 0.91, 5.85, 17.94, 4.94, 6.85, 11.79, 11.49, 8.47, 6.45, 4.64, 5 85, 2.62, 5.85, 2.01, 1.61, (2) 2.41, 0.80, 6.34, 16.70, 5.33, 7.44, 11.97, 12 57, 8.25, 5.84, 4.53, 5.43, 2.62, 5.93, 2.11, 1.71, (3) 2.44, 0.75, 5.99, 17.80, 5 35, 7.43, 12.16, 12.59, 8.00, 5.92, 4.45, 5.18, 2.40, 6.06, 1.90, 1.57, (4) 2.26, 0 79, 6.04, 18.05, 5.27, 6.88, 10.80, 11.24, 9.56, 6.50, 4.38, 6.22, 2.69, 5.89, 1 60, 1.82, (5) 2.51, 0.90, 6.53, 15.98, 5.43, 7.64, 12.26, 12.26, 8.44, 5.83, 4 32, 5.53, 2.31, 6.13, 2.21, 1.71, (6) 2.56, 0.73, 6.35, 13.67, 5.63, 7.25, 11.47, 12 65, 8.75, 6.69, 5.04, 6.30, 2.98, 6.50, 1.84, 1.58, (7) 2.49, 0.81, 6.19, 16.70, 5 33, 7.25, 11.75, 12.14, 8.58, 6.21, 4.56, 5.75, 2.61, 6.06, 1.95, 1.62, (8) 3.64, 0 91, 5.76, 8.08, 8.38, 5.45, 9.59, 14.34, 5.76, 6.77, 7.17, 6.26, 3.53, 9.19, 2 73, 2.42, (9) 4.24, 1.11, 6.66, 6.05, 8.78, 5.45, 9.38, 14.83, 5.45, 6.36, 7.06, 6.86, 3.73, 9.69, 2.32, 2.02, (10) 3.94, 1.01, 6.21, 7.07, 8.58, 5.45, 9.49, 14.59, 5.61, 6.56, 7.12, 6.56, 3.63, 9.44, 2.52, 2.22, (11) 2.19, 0.45, 4.19, 10.05, 6.27, 6.15, 15.00, 18.08, 8.44, 10.01, 6.37, 1.82, 3.09, 5.03, 1.49, 1.37, (12) 2.48, 0.63, 4.42, 10.31, 7.26, 6.77, 14.96, 13.04, 9.80, 11.11, 7.11, 1.83, 3.07, 4.48, 1.30,
Purchased for the exclusive use of nofirst nolast (unknown)
From: SCC Media Library & Resource Center (library.scconline.org)