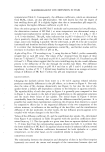
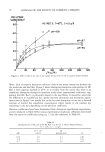
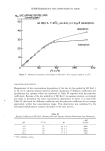
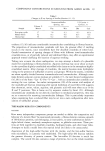
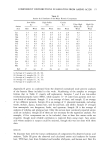
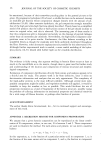
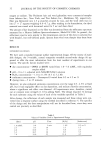
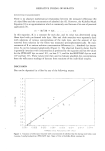
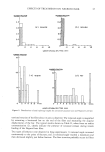
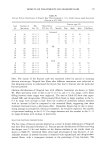
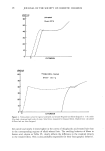
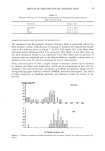
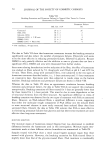
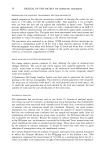
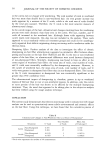
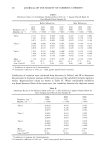
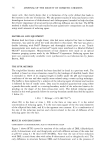
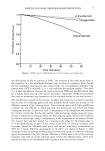
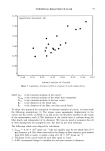
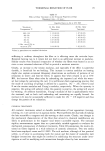
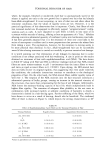
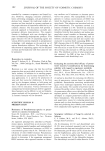
EFFECTS OF TREATMENTS ON NEGROID HAIR 45 Table IV Fracture Pattern Distribution of Negroid Hair Fibers Fatigued to 11 kc Under Various Loads (Survivors) (Fracture at 65% RH) Fracture type (%) Load Number of Brk. Fibers Below (g) Specimens Ext. (%) 22% Ext. (%) Smooth Step Angle Split Fibrillated Untreated 0 36 27 ñ 5 22 6 56 6 l0 32 10 74 32 ñ 3 •4 3 76 8 7 7 20 66 32 ñ 3 13 6 73 11 3 8 30 43 33 ñ 3 10 7 81 9 0 2 40 29 30 ñ 4 17 7 79 7 7 0 SR 0 50 39 ñ 5 16 40 32 4 8 16 10 62 46 ñ 4 10 48 34 3 6 8 20 69 41 ñ 3 8 62 30 1 4 1 30 42 40 ñ 4 7 38 55 2 2 2 40 11 34 ñ 8 9 9 91 0 0 0 TGA 0 50 41 ñ 6 24 40 34 6 10 10 10 67 43 ñ 5 19 64 25 1 6 3 20 57 44 ñ 4 12 67 26 4 4 0 30 33 39 ñ 5 12 73 21 6 0 0 40 12 40 ñ 8 8 42 58 0 0 0 fiber. The nature of the fracture ends was examined either by optical or scanning electron microscopy. Negroid hair fibers after different treatments were subjected to this fatiguing process to understand the factors that lead to fracture and the particular fracture patterns. Lifetime distributions of Negroid hair with different treatments are shown in Table III. Most specimens seem to fall in the 0-0.5 kc and 2-11 kc range a few fibers falling between these ranges were neglected. The data in Table III show that super- relaxed (SR) and thioglycolate (TGA)-treated fibers break in larger numbers in the 0- 0.5 kc range with increase in load. Even the number of immediate failures increases with an increase in load as compared to the untreated fibers, suggesting that these chemical treatments have a deleterious effect. Immediate failure may be due to preex- isting damage accentuated by chemical treatments. As would be expected, the number of specimens breaking in the 0-0.5 kc range increases and the number in the 2-11 kc range decreases with increase in load levels. FRACTURE PATTERN DISTRIBUTIONS The five types of fracture pattern observed as a result of tensile deformation of Negroid hair have been discussed elsewhere (2). Fracture pattern distributions of fibers surviving the fatigue test (11 kc) and broken on the Instron machine in the tensile mode are shown in Table IV. Untreated fibers show high percentages of step fractures. A con- siderable increase in smooth fractures is observed with superrelaxed and thioglycolate- treated fibers, with a consequent decrease in the percentage of step fractures. The

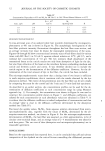
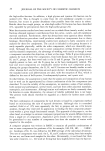
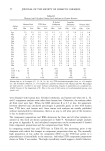
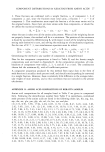
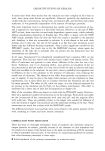
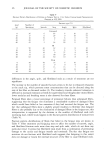
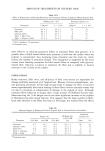
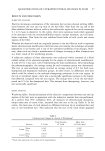
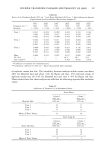
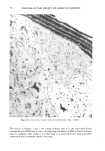
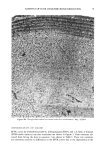
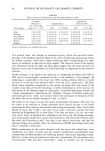
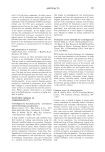
46 ,JOURNAL OF THE SOCIETY OF COSMETIC CHEMISTS Table V Fracture Pattern Distribution of Failures in Fatigue Test to 11 kc Under Various Loads (Nonsurvivors) (Fracture at 65% RH) Fracture type (%) Load Number of (g) Specimens Smooth Step Angle Split Fibrillated Untreated 0 36 6 56 6 10 22 10 17 0 29 0 18 53 20 16 19 0 6 0 75 30 20 17 7 30 13 33 40 45 2 36 29 11 22 SR 0 50 40 32 4 8 16 10 19 53 11 5 5 26 20 11 36 9 27 9 18 30 34 21 38 29 6 6 40 62 24 50 10 8 8 TGA 0 50 40 34 6 10 10 10 11 27 9 0 9 55 20 15 27 13 13 7 40 30 30 17 7 30 13 30 40 58 43 26 5 7 19 differences in the angle, split, and fibrillated ends as a result of treatment are not significant. The increase in the number of smooth fractures seems to be due to enhanced relaxation at the crack tip, which prevents stress concentrations that can be directed along the axis of the fiber as discussed earlier (4). The tendency towards enhanced relaxation is reflected in increased extension at break for superrelaxed and thioglycolate-treated fibers lower modulus and breaking stress is also observed for these fibers. Fatigued fibers show a lower percentage of premature failures than unfatigued fibers, suggesting that the fatigue test eliminates a considerable number of damaged fibers which would have failed at low extension if they had survived the fatigue test. The fact that unfatigued fibers show a slightly greater tendency to fibrillate than fatigued fibers is also probably due to the elimination of damaged fibers in the fatigue test this interpretation is supported by the decrease in the number of fibrillated ends with increasing load, which would appear in the fracture pattern distribution of nonsurvivors (Table V). Fracture pattern distributions of fibers that failed in the fatigue tests are shown in Table V. Fiber treatment and fatiguing seem to affect the number of smooth, angle, and fibrillated fracture ends more than step and split ends, which do not show any particular trend. It seems that fibrillated ends result from a combination of preexisting damage to the cuticle and fatigue (tensile and torsional). The fact that fatigue test survivors do not fracture with fibrillated ends suggests that fatiguing to this extent does not damage or loosen the internal structure of the fiber to cause fibrillated ends.
Purchased for the exclusive use of nofirst nolast (unknown)
From: SCC Media Library & Resource Center (library.scconline.org)