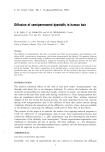
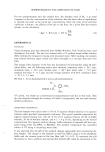
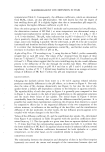
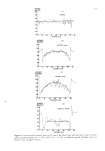
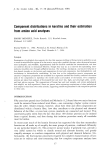
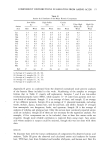
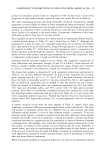
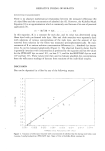
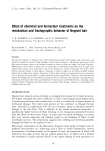
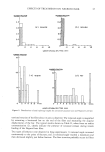
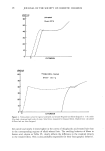
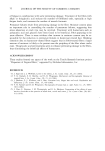
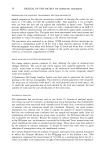
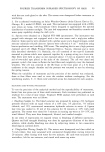
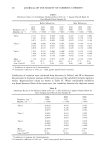
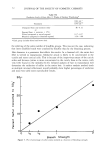
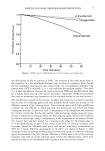
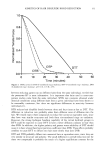
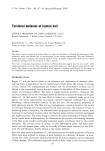
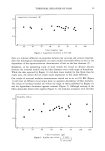
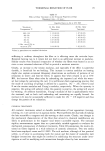
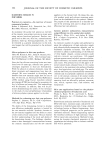
QUANTIFICATION OF ULTRASTRUCTURAL CHANGES IN HAIR 55 . ., . ,...• .: : . , .... Figure 2. Hair fiber subjected to normal grooming processes showing voids in endocuticle (50,000 x ). and then use this technique to study the effects of weathering and shampooing on the non-keratinous components of the hair. MATERIALS AND METHODS HAIR SAMPLING Brown hair fibers were obtained from one female subject whose hair had not been treated with any chemically reactive cosmetic products. Twenty fibers, each approxi- mately 18 cm in length, were cut as close as possible (1 to 2 mm) to the scalp. All hair fibers were sampled from a mid-region in the back of the head. SHAMPOO TREATMENT After sampling, the hair was divided equally into two tresses of ten fibers each which were secured at the root end. The tresses were then clipped to a one-gram laboratory hair tress for shampoo treatment. The shampooing treatment consisted of a double lathering with a conventional anionic shampoo followed by air drying. One tress was shampooed through 90 shampoo cycles during a one-week period. This multiple sham- pooing treatment was designed to simulate approximately six months of on-the-head shampooing (3.5 shampoos per week). The second tress was shampooed through one shampoo cycle and was retained as a non-shampooed control.

56 JOURNAL OF THE SOCIETY OF COSMETIC CHEMISTS PREPARATION FOR SCANNING TRANSMISSION ELECTRON MICROSCOPY Sample preparation for electron microscopy consisted of staining the tresses for two hours in 1.3% OsO4 in 0.067 M cacodylate buffer. Hair segments, 1 cm in length, were cut from the root and tip regions and embedded in Spurr's resin. Transverse sections approximately 120 nm thick were cut with a diamond knife in an LKB Ul- tratome NOVA ultramicrotome and collected on 200-mesh copper grids containing a formvar-carbon support film. The grids were then post-stained with uranyl acetate and lead citrate for image enhancement. A thin layer of carbon was evaporated onto the specimens to reduce electrostatic charging in the electron microscope. The specimens were examined in an Areray 1200B scanning electron microscope op- erated in a transmission mode at 30 Kv with a final objective aperture of 200 •m. Photomicrographs were taken with Polaroid Type 52 black and white film. A total of 160 photomicrographs were taken at random of the cuticle and outer portion of the cortex at a final print magnification of 5000. IMAGE ANALYSIS OF ELECTRON MICROGRAPHS The image analysis process consisted of, first, defining the types of ultrastructural changes observed. The cuticle and cortex regions were analyzed separately. In the cuticle, round holes or voids originating in the endocuticle were differentiated from linear voids which occurred between cuticle layers. In the cortex, irregularly shaped voids were analyzed. A Quantimet 900 Image Analysis System was then used to quantirate the voids ap- pearing in the electron micrographs. Once detected, several parameters were measured: the mean area of individual voids (•m2), the total projected area of voids (•m2), the % voids (the total projected area of voids divided by the total area scanned), the total number of voids and the size distributions of the mean areas. STATISTICAL ANALYSIS The experiment has two factors, each at two levels: (1) location of analyzed region, root versus tip and (2) treatment, no shampooing versus shampooing. Four independent test conditions were examined with a sample size of 40 each thus, a two-factor analysis of variance with no interaction model was considered. However, the equal variance assumption was violated and, in order to employ the analysis of variance technique, the four test conditions were combined into one sample and assigned ranks. Since all comparisons involved testing one group mean to another, the Wilcoxon rank-sum test was a plausible test statistic. Because the analysis of variance technique does not apply to the Wilcoxon test, an alternative is provided by Fisher and Yates' normal scores test which transforms the ranks to standard normal values. These values were then analyzed by the analysis of variance technique. It should be noted that there were no gross violations of assumptions using the transformed variates. All t-values obtained from the analysis of variance techniques were adjusted downward to reflect the Pittman efficiency of the Wilcoxon test to the Student t-test. This adjustment employed the lower bound of X/0.864 as a multiplying factor for all t- values in an effort to be conservative in light of the transformations that were employed.
Purchased for the exclusive use of nofirst nolast (unknown)
From: SCC Media Library & Resource Center (library.scconline.org)