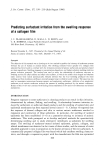
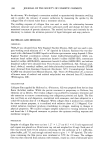
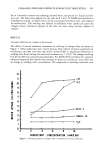
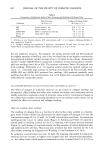
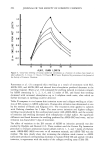
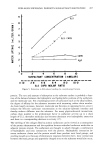
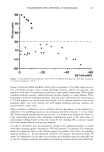
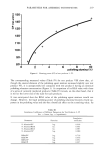
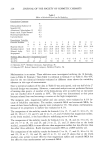
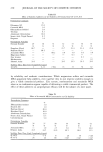
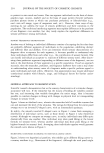
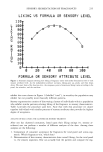
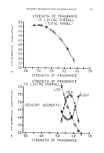
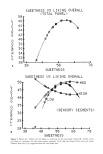
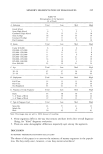
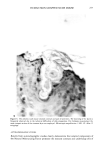
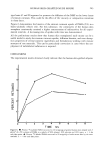
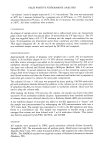
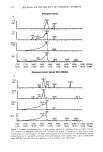
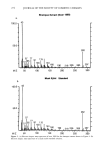
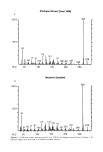
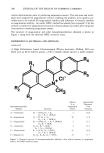
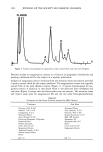
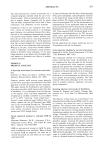
216 JOURNAL OF THE SOCIETY OF COSMETIC CHEMISTS Table I Composition of Test Product VI Concentration Ingredients (%) Water 37.4 Glycerin 86% 20.0 Sorbitol 70% 20.0 PEG-150 10.0 Alumina l 0.0 Flavor 1.2 PEG-60 Hydrogenated Castor Oil 0.6 Carbomer 940 0.5 Aminomethyl Propanol 0.2 Methylparaben 0.1 RESULTS As a general orientation, 20 toothpastes from the European and American markets were first tested for polishing and scratching effects. The results of these investigations given in Figure 1 show that the scratching values of the various pastes cover a wide range. It is particularly apparent that even the pastes with the lowest scratching values reveal only a slight polishing effect. This can be interpreted as an indication that the desired high polishing effects are not achieved with cleaning agents generally used today. On the basis of screening tests, it then became evident that toothpaste formulas with an addi- tion of polishing alumina satisfy this requirement very well. Test products I-VI with a polishing alumina content between 1% and 10% as the sole abrasive were therefore investigated. The results of polishing measurements presented in Figure 2 show that the polishing effects of test products I-VI improve with increasing cleaning agent concentration and at a high level tend towards a limit. The comparison of scratching and polishing values of test products with those of market products given in Figure 1 demonstrates that the test products scarcely scratch and polish comparatively well. Table II Composition of Test Product VII Concentration Ingredients (%) Water 19.65 Glycerin 86% 13.00 Sorbitol 70% 40.00 Hydrated Silica 17.00 PEG-4 4.00 Sodium Lauryl Sulfate 2.00 Titanium Dioxide 1.00 Flavor 1.20 Cellulose Gum 0.30 Further Ingredients 1.85

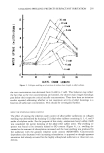
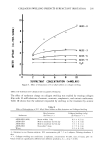
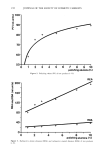
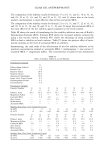
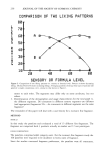
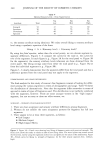
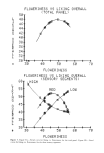
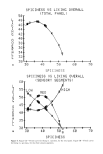
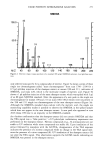
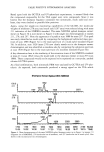
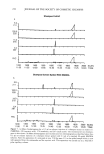
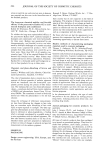
PARAMETERS FOR ASSESSING TOOTHPASTES 217 gO- 70- 50- - 30- 10- -10- -30 0 +++++ I I I I -20 -40 -60 SV (rel. units) Figure 1. Scratching (SV) and polishing values (PV) of 20 different European and American toothpastes (+) and test products I-VI (*). Figure 3 shows the RDA and REA values of the test products. The RDA values are very low and barely increase with a rising polishing alumina content. In contrast, test product I with only 1% polishing alumina has a high enamel abrasiveness. With higher polishing alumina contents, enamel abrasion increases sharply in a linear fashion. With increasing contents of polishing alumina, cleaning values determined for test products I-VI also improve, as can be seen from Figure 4. In a manner similar to that of the polishing effect, the curve flattens out with higher polishing alumina contents and tends towards a limit value. High correlation coefficients can be calculated for the dependence of the different pa- rameters on the polishing alumina concentration presented in Figures 2-4 (see Table III). From a purely mathematical point of view, it is therefore no surprise that there is a close relationship between other parameter combinations given in the same table. A particularly striking feature is that the values for the cleaning effect correlate equally well with dentin abrasion and enamel abrasion. In order to determine how the parameters change if the polishing alumina is mixed with other cleaning agents, test product VIII was analyzed. It consisted of a toothpaste based on amorphous silica as the cleaning agent (test product VII) with 1% polishing alumina added to it. As the measured values for test product VII given in Table IV show, its composition is such that its scratching and polishing values are especially low so that the changes caused by the addition of polishing alumina can be easily identified.
Purchased for the exclusive use of nofirst nolast (unknown)
From: SCC Media Library & Resource Center (library.scconline.org)