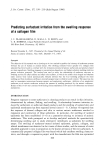
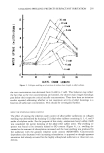
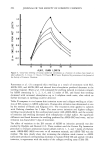
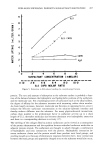
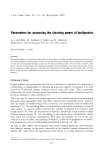
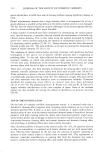
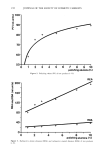
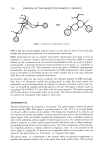
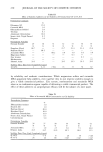
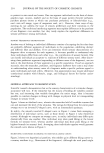
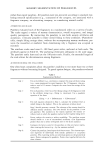
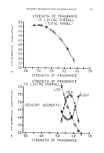
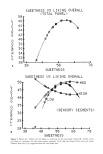
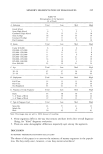
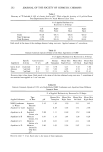
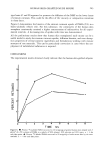
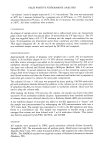
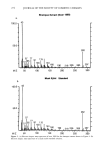
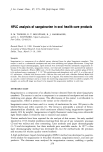
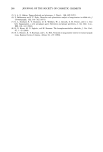
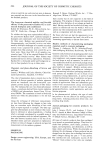
218 JOURNAL OF THE SOCIETY OF COSMETIC CHEMISTS 100- 90- 80- 70- 60 -!- -!- -!- -!- -!- 50 0 2 3 4 5 6 7 8 9 10 polishing alumina (%) Figure 2. Polishing values (PV) of test products I-VI. 200- _ 160- 120- 80- 40 REA + + + RDA 0 I ! I I I I I I I i 0 2 4 6 8 10 polishing alumina (%) Figure 3. Radioactive dentin abrasion (RDA) and radioactive enamel abrasion (REA) of test products I-VI.

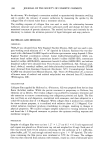
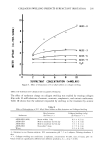
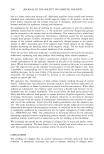
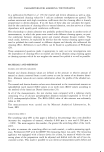
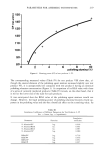
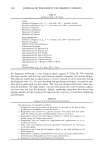
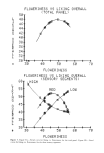
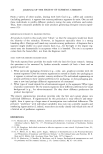
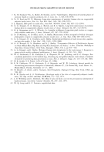
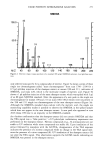
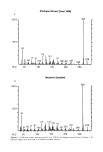
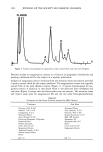
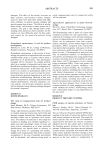
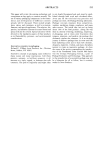
PARAMETERS FOR ASSESSING TOOTHPASTES 219 11 1t o I I I I I I I I I 2 4 6 8 10 polishing alumina (%) Figure 4. Cleaning power (CP) of test products I-VI. The corresponding measured values (Table IV) for test product VIII show that, al- though the enamel abrasion of the polishing agent mixture increased slightly over test product VII, it is unexpectedly low compared with test product I having an identical polishing alumina concentration (Figure 3). A comparison of its REA value with those of a series of currently marketed products (Table IV) reveals, on the other hand, that it is still at the lower end of the scale for such products. It was anticipated that the RDA value of the polishing agent mixture would not change. However, the high polishing power of polishing alumina becomes clearly ap- parent in the polishing value and also has a beneficial effect on the scratching value. As Table III Correlation Coefficients of Different Parameters for Test Products I-VI (lin. = linear, log. = logarithmic) Correlation- Parameter Function coefficient % Alumina/PV log. 0.910 % Alumina/RDA lin. 0.961 % Alumina/REA lin. 0.987 % Alumina/CP log. 0.980 RDA/PV log. 0.736 REA/PV log. 0.936 RDA/CP log. 0.952 REA/CP log. 0.927
Purchased for the exclusive use of nofirst nolast (unknown)
From: SCC Media Library & Resource Center (library.scconline.org)