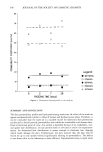
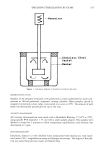
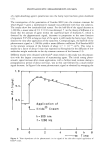
CLEANSING BAR EVALUATION 313 Skin care potential of the difj•rent soaps. The test was conducted May 14 to June 8, 1984. Twenty-eight volunteers (average age • = 35 s = 10.4 14 m, 14 f) took part. Informed consent was obtained. The volunteers used the soaps on one forearm and one half of the face two times per day. Both hands were cleaned with one of the soaps as often as needed. Only Nivea © Cream was used as a skin care product on the face. The test period always began on Monday and ended on Friday. Then the products to be tested were changed. The sequence of use was randomized. The following measurements were performed: Monday: Preparation of skin replicas of both lower forearms and both cheeks rep- licas were measured for the roughness parameter Rz according to (13) (Rz is defined as the mean value of five consecutive maximum/minimum dis- tances within five consecutive segments of the whole scanned profile). Tuesday: Evaluation of negative charge density on the lower forearms 12 hours after product use. Wednesday: Measurement of transepidermal water loss (only male volunteers) (15 a). Friday: Preparation of skin replica. pH measurements on taped-stripped skin. a) To estimate pH shifts within different layers of the stratum corneum occluded for 24 hours with 8% and 2% solutions of D and A, measurements were performed at treated and untreated sites before and after stripping (two volunteers). With one additional volunteer, this was done before and after performance of physical exercise (running for about V2 km). b: Ten volunteers (5 m, 5 f) took part. The test was performed June 19-21, 1985. One lower forearm was washed with D for one minute using tap water at 32øC the other forearm remained untreated. Each arm was stripped by tape. Before and after removal of one, two, four, eight, and sixteen strips, the pH values of the stripped areas were determined. Around 50 strips were necessary to remove the whole horny layer. Irritancy of free fatty acids (FFA) of B, C, and D compared with A. 8% solutions of the three classical soaps were acidified. The precipitates of primarily FFAs were filtered. The residues were dried and thoroughly mixed with petrolatum (Deutsche Arzneibuch quality). The resulting suspensions contained FFAs in the same percentage as 8% solu- tions of the soaps. Grated A was also suspended in petrolatum at a concentration of 8%. An 8% solution of A in water was added as a control. The test using the suspensions and solutions was performed (as described above in "visual scoring and skin surface pH values") from June 3-5, 1985 on the backs of 26 volunteers. Extractive potentiah of 1% solutions of A and D. Twenty volunteers (10 m, 10 f) took part. The test was performed September 16-20, 1985. A funnel (diameter ca. 35 mm) was pressed to the inner side of the lower forearms. 3.5 ml of either A or D (1% solutions in distilled water) was injected through the funnel tube. The liquid was shaken moder- ately for two minutes. Care was taken to avoid any leak between the skin surface and the rim of the funnel. The extract was analyzed for ninhydrin-positive material. To determine the sensitivity of the analytical method, standard solutions were prepared from the two extraction media containing a range of serine concentrations.

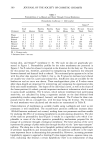
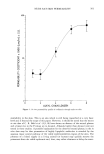
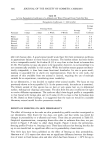
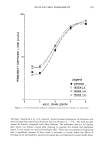
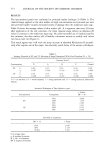
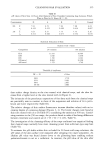
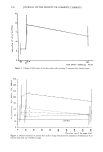
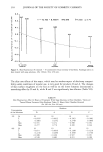
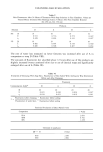
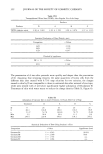
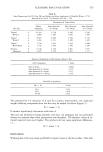
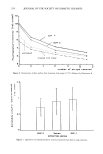
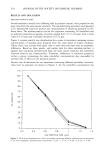
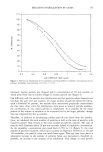
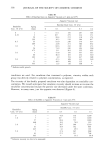
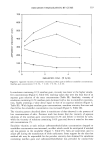
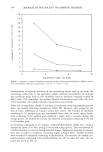
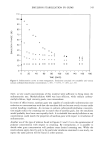
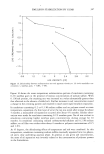
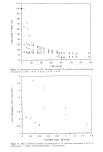
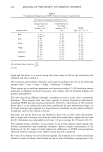
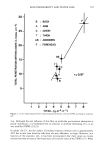
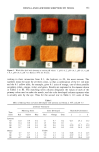
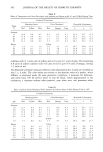
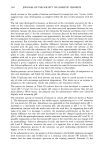
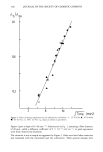
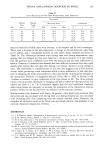
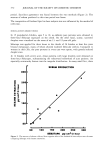
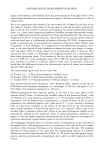
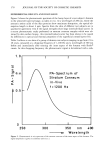
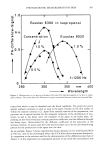
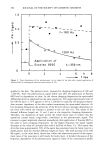
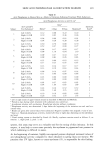
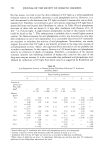
314 JOURNAL OF THE SOCIETY OF COSMETIC CHEMISTS RESULTS The epicutaneous patch test confirmed in principle earlier findings (1) (Table I). The classical soaps applied at the skin surface in high concentrations and amounts per unit area provoke higher visually estimated scores of damage than the surfactant-type soap. Table II shows the average values of skin surface pH. It is apparent that even 24 hours after application of the test solutions, the three classical soaps enforce an alkaline pH value in contrast to the surfactant-type soap. But after extended use of classical soap for five minutes, the skin surface pH of healthy volunteers returns to weakly acid values two hours later (4) (Figure 1). This result agrees very well with the steep increase of adsorbed Rhodamine B immedi- ately after regular use of the soaps, the relatively quick decay of the anionic pH-depen- Table I Irritancy Potential of 8% and 2% Solutions of Soaps Determined With Finn Chambers (N = 20) Irritancy Score* Concentration D A B C Control 8% • 0.69 0.32 0.55 0.44 0.00 s x 0. 307 0. 249 0. 339 0. 332 0.000 2% • 0.36 0.15 0.35 0.35 0.00 Sx 0.248 0.117 0.232 0.198 0.000 * 0 = no reaction, 0.5 = weak erythema, 1 = strong erythema, and 1.5 = strong erythema, blisters and fissures. Statistical Evaluation of Data (Student t-test) t Values Concentration Comparison DF = 36 8% 2% D/A 4. O64 D/B 1.354 D/C 2.383 D/A 3.347 D/B 0. 135 D/C 0. 144 Thr•s3olds of signi•5'cance.' DF = 35 t Value 95% 99% 99.9% 2.030 2.724 3.591 i & average value. Sx & standard deviation. N /x No. of volunteers. DF & degrees of freedom.
Purchased for the exclusive use of nofirst nolast (unknown)
From: SCC Media Library & Resource Center (library.scconline.org)