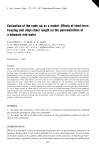
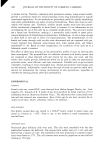
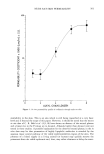
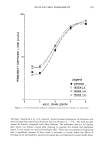
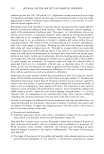
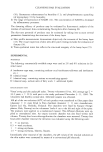
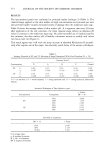
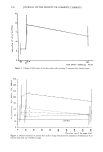
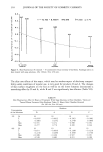
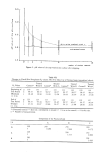
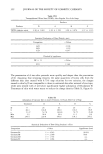
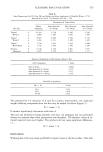
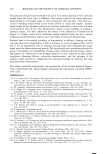
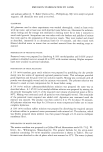
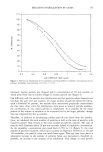
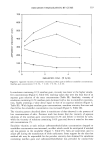
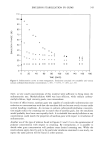
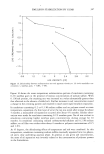
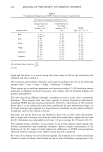
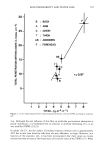
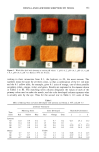
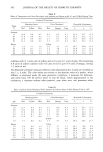
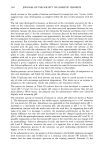
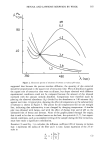
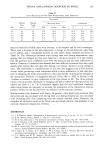
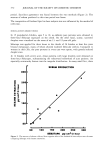
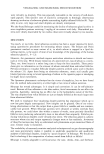
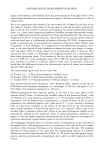
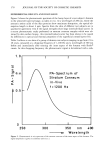
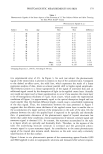
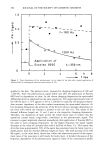
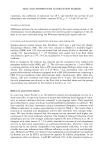
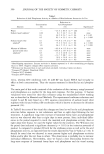
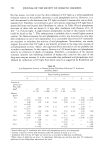
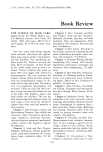
CLEANSING BAR EVALUATION 317 Table III Irritancy Potentials of Free Fatty Acids (FFA) From Soaps B, C and D, and powdered A* Products D A B C 8% Solution Scores (FFA) (powdered) (FFA) (FFA) of A 24h 0 1 X 0.5 0 0 5 X 0.5 2 X 0.25 lO X 0.25 E o 1 o o 5 • 0 0.04 0 0 0.2 1x0.5 48h 0 1 x 0.25 0 0 13 x 0.25 • 0 0.25 0 0 3.75 • 0 0.01 0 0 0.15 * Free fatty acids and powdered A were tested as 8% suspensions in petrolatum applied to the backs of 26 subjects for 24 hours. Readings were taken using the scale in Table I 24 and 48 hours after removal of test materials. regular use of soap is only changed significantly 2-3 layers down, i.e., it is limited to the top layers (Figure 5). Induction of thermal sweating by running for a few hundred meters 24 hours after treatment with soap solution in Finn chambers caused complete neutralization of the residual soap at the skin surface a pH value of about 6.5 was obtained. 1.2 1. o I o oe o O.B rY -0. 2 Y = 0.266 + 0.•575 ß X r•O. 996 N-21 14-14 N-2g N-2g N-41• . Figure 3. Skin fluorescence (F (treated) - F (untreated)) versus intensity of erythema. Readings taken on skin treated with soap solutions. (Ex: 290nm / Em: 350nm). no v•.mtble ,m,m •k

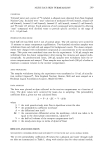
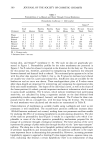
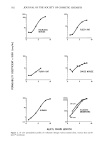
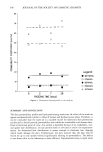
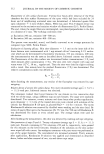
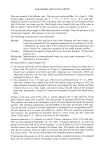
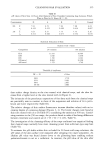
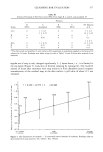
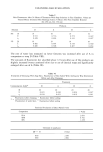
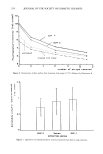
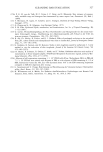
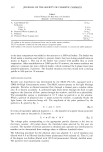
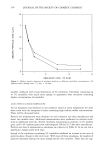
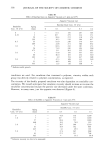
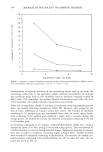
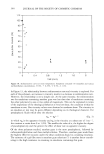
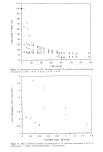
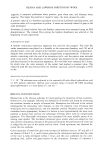
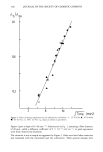
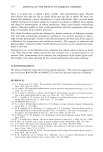
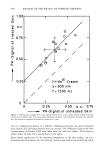
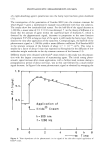
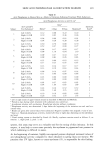
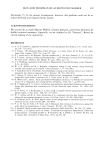
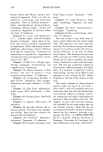
318 JOURNAL OF THE SOCIETY OF COSMETIC CHEMISTS o I o • •.1 L 0 Y - -I•. 455 * I•. 493/X B-O. 940 •.-'7. glõ d. 'F. -4 N-,43 0 0 N-21 Figure 4. Skin fluorescence (F (treated) - F (untreated)) versus intensity of erythema. Readings taken on skin treated with soap solutions. (Ex: 360nm / Em: 450 nm). The skin-care effects of the soaps, which may be another aspect of skin/soap compati- bility under conditions of regular use, is very good for products D and A. The changes of skin surface roughness on the face as well as on the lower forearms demonstrate a smoothing effect by D and A, while B and C are significantly less effective (Table VII). Table IV Skin Fluorescence After 24 Hours of Treatment With Soap Solutions in Finn Chambers. Values are Treated Minus Untreated Skin Readings Taken 24 Hours After Chamber Removal (Ex 360 nm, Em 450 nm) Products Concentration of the Solutions D A B C 2% 8% N 19 19 19 19 • -- 0.0797 - 0.0632 -- 0.1563 -- 0.1083 s x 0. 1863 0.2342 0.2748 0. 1896 Min -0.355 -0.274 -0.788 -0.392 Max 0.277 0.770 0.399 0.244 N 19 19 19 19 • - 0.673 - 0.0656 - O. 1398 - O. 1210 s x O. 2216 0.2690 O. 1849 O. 1766 Min - O. 398 - 0.406 -- O. 507 - O. 391 Max O. 519 0.682 0.221 O. 190
Purchased for the exclusive use of nofirst nolast (unknown)
From: SCC Media Library & Resource Center (library.scconline.org)