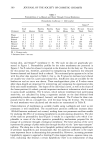
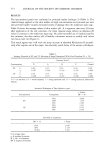
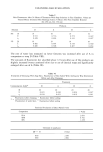
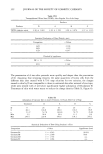
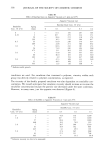
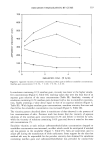
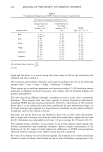
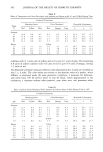
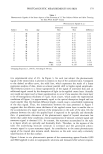
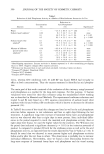
CLEANSING BAR EVALUATION 321 Table VII--Continued Thresholds of significance,' DF = 300 t Value 95% 1.970 99% 2. 596 99.9% 3.33O Changes in Forearm Skin Roughness (Rz values) After Five Days Use of Various Soaps (normalized values) Treated Treated Treated Treated Rz Values Control* With D Control* With A Control* With B Control* With C Beginning of n 319 317 297 293 310 307 309 310 Test Period • 89.05 89.05 89.05 89.05 89.05 89.05 89.05 89.05 (Mondays) s 15.80 17.74 17.80 18.98 17.37 16.86 19.34 22.91 (= Oh) End of n 309 306 272 286 311 309 283 296 Test Period • 89.05 85.09 89.05 85.08 89.05 87.78 89.05 89.52 (Fridays) s 18.92 18.77 18.59 18.47 16.65 17.90 20.53 19.20 (= lh) * (Untreated) control = skin site, contralateral to treated (= 1 h) or to be treated = 0 h) skin site. Comparison Before Comparison And After Product Comparison of the Untreated/Treated Application Products/Code lh DF f• Oh/1 h DF t lh A Control/D 613 2.605 D 621 2.707 D DF 590 Control/A 556 2.530 A 577 2.550 t 0.007 Control/B 618 0. 526 B 614 0.521 DF A Control/C 577 0.285 C 604 0.273 t DF B 613 3.171 593 3.151 600 2.863 580 2.842 603 0. 172 Thresholds of significance: DF = 600 t Value 95% 1.964 99% 2.585 99.9% 3.308

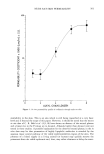
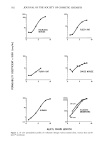
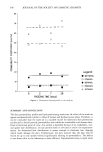
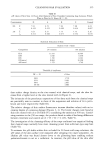
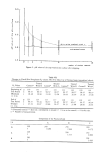
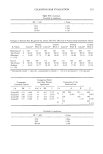
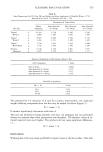
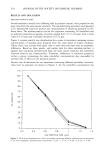
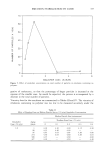
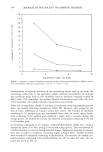
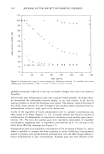
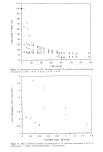
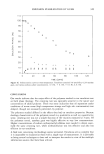
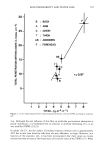
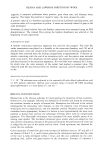
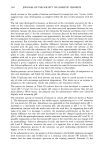
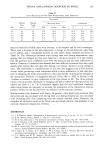
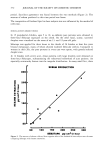
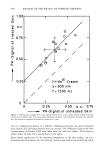
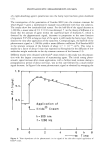
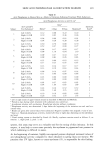
322 JOURNAL OF THE SOCIETY OF COSMETIC CHEMISTS Table VIII Transepidermal Water Loss (TEWL) After Regular Use of the Soaps Products Products D A B C TEWL (relative units) 3.18 ñ 1.081 3.92 ñ 1.592 3.29 --- 1.076 3.37 --- 1.215 Statistical Evaluation of Data (Paired t-test) Comparison t Values A/D 2. 194 B/D 1. 122 C/D 0.977 Threshold of significance: DF = 13 t Value 95% 2. 160 The penetration of A into skin proceeds more quickly and deeper than the penetration of D. Assuming that stripping removes the same quantities of horny cells from the different skin sites treated with 0.75% soap solutions for two minutes, the charges caused in skin by D are comparable to those in untreated skin after removal of six strips, while sites treated with A still show significantly higher adsorption of Rhodamine B. Treatment of skin with water seems to reduce the charge density (Table X, Figure 6). Table IX Adsorption of Cationic Dye on Lower Forearms 12 Hours After Use of Soap Untreated D A B C N 77 26 26 26 25 • 84.1 104.8 160.0 110.6 98.9 s 51.37 52.78 130.83 70.75 45.82 Min 2.2 28.0 19.4 11.2 9.6 Max 250.4 229.8 550.6 318.2 244.2 Statistical Evaluation of Data Using Student's t-Test Comparison t Value Significance Level Untreated/A { = 4.243 99.9% Untreated/B { = 2.058 95 % Untreated/D { = 1.765 n.s. Untreated/C • = 1.284 n.s.
Purchased for the exclusive use of nofirst nolast (unknown)
From: SCC Media Library & Resource Center (library.scconline.org)