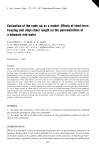
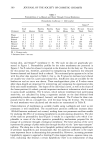
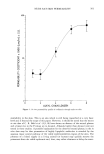
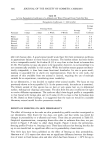
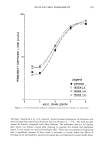
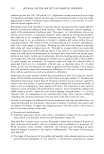
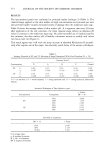
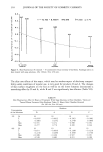
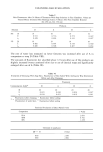
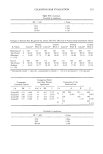
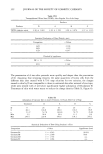
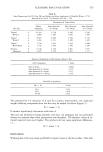
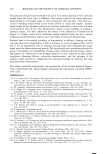
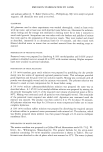
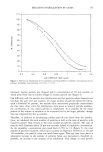
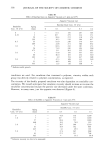
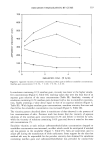
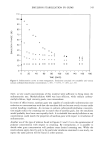
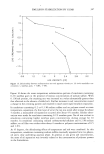
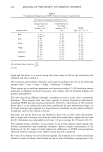
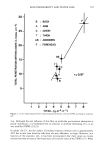
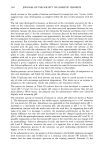
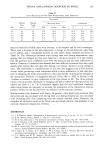
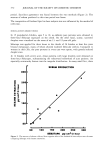
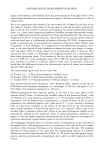
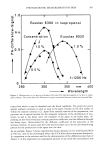
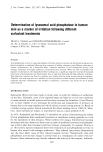
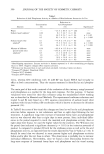
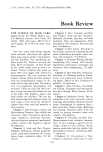
340 JOURNAL OF THE SOCIETY OF COSMETIC CHEMISTS 26 (D o o { 24- 22 20- 18- 16- 14- 12- 10- 8- 6- 4- 2- 0 0 2 4 6 EMULSIFIER CONC. (% W/W) Figure 7. Apparent viscosity of emulsions containing sodium carboxymethylcellulose at different emulsi- fier concentrations. Polymer concentration: [] 0.5%, + 1.0%, O 1.5%. measurements on aqueous solutions of the emulsifying agents used in our work. By converting conductivity to the equivalent sodium chloride concentration, we estimate that emulsions made with 0.25% emulsifier (and no polymer) contained 0.0026 M NaC1 with 1.0% emulsifier, the sodium chloride concentration was 0.0034 M with 5.0% emulsifier, the sodium chloride concentration was 0.02 M. There was no significant change in viscosity of emulsions containing xanthan gum for about two months following manufacture (Table III). However, after storage for one year or more, differences in viscosity values were noted. The viscosity of emulsions containing 0.1% xanthan gum was considerably lower than the initial values. Emul- sions containing 0.2% xanthan gum exhibited a slight drop in viscosity during this storage period. An increase in viscosity was observed in emulsions containing 0.3% and 0.4% xanthan gum. In emulsions containing 0.5% sodium carboxymethylcellulose (Table IV), viscosity dropped by about 10 to 50% during a two-month storage period. This was followed by a further decrease in viscosity during extended storage. Substantial decreases in viscosity were also recorded in emulsions containing higher polymer levels. Smaller decreases were recorded for emulsions containing methylcellulose. The viscosity of a freshly pre- pared emulsion containing 1.0% methylcellulose was 207 cp after 297 days, the vis- cosity was down to 154 cp.

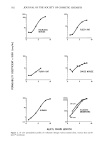
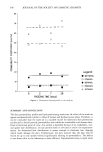
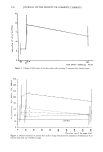
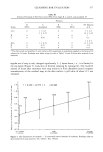
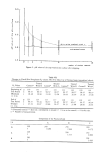
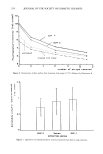
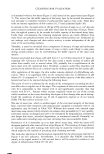
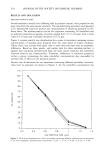
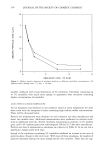
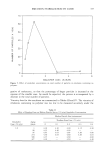
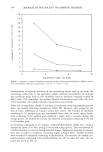
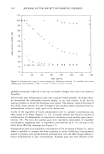
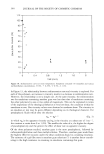
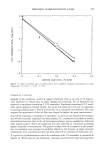
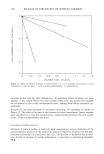
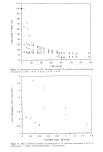
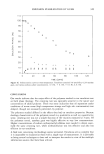
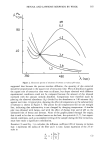
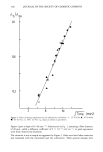
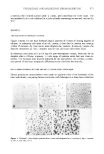
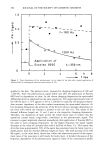
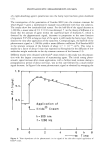
EMULSION STABILIZATION BY GUMS 341 Changes in viscosity over time are somewhat difficult to interpret because of the multi- plicity of factors that can come into play. A decrease in viscosity may be associated with an increase in emulsion particle size, chemical breakdown of the stabilizing polymer, or, less likely, a decrease in the extent of flocculation of emulsion globules. An increase in viscosity with time might reflect an increase in polymer hydration (not likely because the greatest change in hydration would be expected to occur during the first days or weeks after manufacture rather than the much longer time period found here), an in- crease in the degree of flocculation, or perhaps some interaction between components that takes place over a long period of time because one of the components has to un- dergo interfacial diffusion. MICROSCOPY Emulsions (usually diluted with an equal amount of water presaturated with mineral oil) were examined under the microscope at 150 x magnification. All appeared to be flocculated to some degree following extended storage, although there were large differ- ences in structural arrangement and particle density. The floccules in emulsions made without polymer were relatively small and apparently weakly bonded. A similar picture was observed in emulsions containing xanthan gum. In the presence of sodium carboxy- methylcellulose, larger, denser agglomerates were observed. In emulsions containing methylcellulose, an intermediate pattern was observed particle networks were more clearly defined than in emulsions made with xanthan gum but more diffuse than in emulsions made with sodium carboxymethylcellulose. Particle size distributions were determined from several of the photomicrographs and compared with results obtained from the electronic particle sizer. In general, the results were in agreement median values fell within the same range. SEDIMENTATION AT ROOM TEMPERATURE We use the terms "creaming" and "sedimentation" interchangeably. As a result of sedimentation, our emulsions usually separated into two phases, one of which was rela- tively opaque and accumulated at the top of the system, which we designate the "emul- sion phase," and a second phase of higher density consisting largely of the medium. Sedimentation curves for emulsions containing the polymers studied and 1% emulsifier are shown in Figures 8 to 10. Initially, the boundary between the phases moved up- ward, and the relative volume of emulsion phase gradually decreased from 100% with time while the volume of medium grew (Figures 8-10). The sedimentation curve was usually linear during the initial period. In many instances, sedimentation, which was monitored visually, began immediately following manufacture. In some cases (emul- sions containing 0.3% xanthan gum in Figure 8, for example) sedimentation proceeded slowly following an induction period during which no separation of the emulsion was observed. With emulsions that creamed rapidly (for example, those containing no polymer), the volume of the creamed emulsion increased somewhat due to continued sedimentation of emulsion globules after the initial, more rapid separation of emulsion and medium. Very little separation was observed in the emulsions containing 3% or 5% emulsifier. In some, a very thin layer of concentrated emulsion (probably consisting of the largest
Purchased for the exclusive use of nofirst nolast (unknown)
From: SCC Media Library & Resource Center (library.scconline.org)