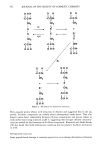
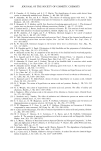
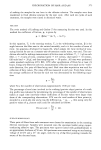
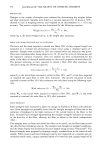
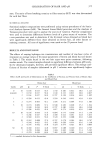
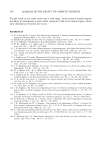
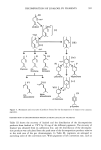
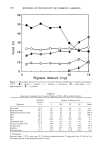
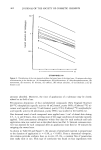
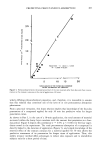
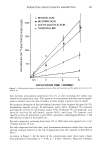
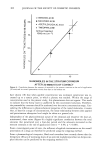
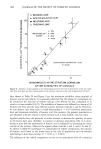
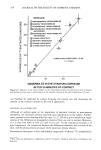
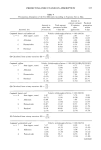
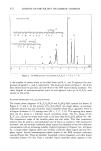
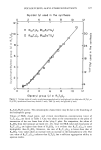
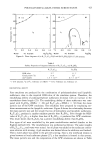
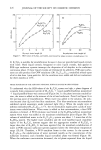
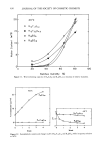
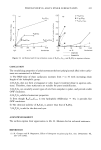
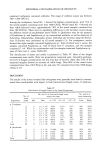
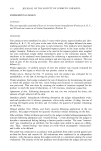
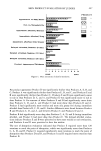
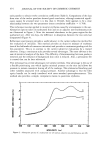
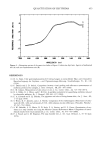
PREDICTING PERCUTANEOUS ABSORPTION 403 25 o o ? o o : Y . 1.644 x - 0,536 998 P 0.001 lO 15 NANO MOLES IN THE STRATUM CORNEUM AFTER 30 MINUTES OF CONTACT Figure 4. Relationship between the penetration level of the test materials after four days and their concen- tration in the stratum comeurn at the end of application (30 min). widely differing physicochemical properties, and, therefore, it is reasonable to assume that this relation may constitute one of the laws of in vivo percutaneous absorption phenomena. From a practical viewpoint, this linear relation implies that knowledge of the four-day penetration of a compound applied for only 30 min has predictive value for longer penetration times. As shown in Part I, in the case of a 30-min application, the total amount of material recovered within the horny layer correlates with the amount that penetrates in a four- day period. Figure 6 depicts this correlation (r = 0.99, p 0.001) for the four ingre- dients tested in the experiment. The total percutaneous absorption of a compound is directly linked to the duration of application (Figure 5), and simple knowledge of the reservoir effect of the stratum corneum for a material applied for 30 min allows the predictive assessment of its penetration for longer times of application. Thus, this mildly invasive method offers advantages to reduce skin exposure and to immobilize subjects only for a short period of time.

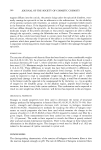
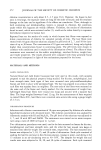
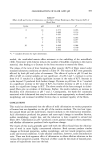
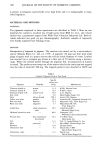
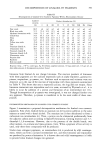
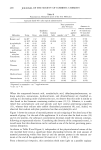
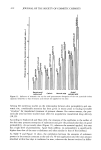
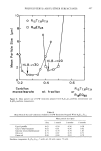
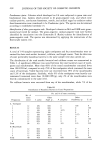
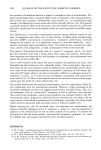
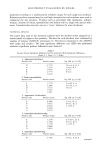
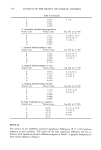
404 JOURNAL OF THE SOCIETY OF COSMETIC CHEMISTS Table III Percutaneous Absorption Levels of the Test Molecules According to Their Application Time in the Hairless Rat Total amounts found 96 h after topical application Epidermis + dermis area Animal Compounds Urine Feces treated body Total penetration Amounts in stratum corneum of treated area 30 min after application Theophylline 0.5 1.61 a 0.20 0.04 0 '-• (0.11) b (0.03) (0.09) • 2 5.78 0.77 0.35 0.08 '• (1.22) (0.08) (0.17) (0.05) g 4 10.79 1.14 0.25 0.14 • (1.12) (0.23) (0.07) (0.05) • 6 21.18 2.93 0.57 0.42 1 (4.31) (0.62) (0.13) (0.19) Acetylsalicylic acid 0.5 6.86 0.80 0.42 0 (1.16) (0.53) (0.11) • 2 21.29 2.53 1.72 0.15 • (0.14) (0.45) (0.41) (0.05) .:2. 4 45.28 4.57 3.71 0.01 • (2.64) (t.89) (0.77) (0.006) • 6 72.21 8.02 2.40 0.01 (13.90) (1.14) (1.32) (0.01) Nicotinic acid • 0.5 6.67 1.12 0.71 7.20 • (1.35) (0.22) (0.06) (1.01) .• 2 16.30 6.11 3.06 19.31 = (5.39) (1.14) (0.23) (5.81) ß • 4 48.02 6.62 4.87 63.94 • (11.35) (1.23) (0.49) (13.90) c• 6 79.02 7.40 8.71 84.89 (26.74) (2.75) (1.45) (33.83) 1.85 2.53 (0.11) (0.30) 6.98 (1.36) 12.31 (1. is) 25.12 (4.78) 8.09 5.15 (1.67) (0.60) 25.69 (1.90) 53.57 (2.39) 82.65 (13.99) 15.71 9.72 (2.46) (0.86) 44.75 (11.67) 123.45 (25.50) 180.02 (61.47) Benzoic acid 0.5 17.43 0.85 0.40 0.06 18.75 (2.38) (0.27) (0.13) (0.02) (2.57) 2 73.10 4.65 0.63 0.21 78.60 (3.06) (2.85) (0.15) (0.01) (5.18) 4 135.58 7.77 1.73 0.23 145.32 (13.53) (1.67) (0.39) (0.07) (12.69) 6 173.20 9.90 1.81 0.25 185.20 (22.72) (3.12) (0.36) (0.11) (22.55) 10.46 (0.98) a Expressed in nanomoles ß cm -2 application area b S.D.' (n = 5). INFLUENCE OF DOSE APPLIED In most medical and toxicological specialties, the administrated dose is defined pre- cisely. This has not always been the case in dermatotoxicology and dermatopharma- cology. However, it is well known that increased concentration of applied chemical on
Purchased for the exclusive use of nofirst nolast (unknown)
From: SCC Media Library & Resource Center (library.scconline.org)