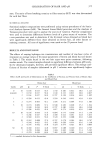
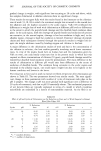
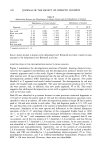
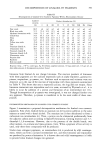
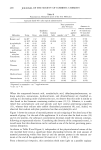
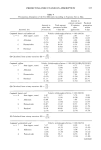
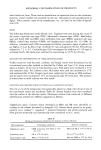
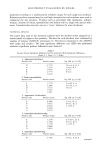
PREDICTING PERCUTANEOUS ABSORPTION 4 13 Table V Percutaneous Absorption of the Test Molecules According to Anatomic Site in Man Anatomic site Amount in Total amount urine after penetrated within 24 hours (A) 4 days (B) Amount in stratum corneum 30 minutes after application Predicted penetration within 4 days Compound.' benzoic acid sodium salt Vehicle: (ethyleneglycol/triton x 100) (90/10) n = 6 Arm (upper, outer) 3.02 (0.34) 6 Abdomen 5.73 (0.54) 6 Postauricular 7.54 (0.62) 8 Forehead 9.31 (1.76) 4.02 2.83 4.67 (0.45) (0.58) (1.07) 7.65 4.04 6.88 (0.72) (0.98) (1.80) 10.06 6.29 11.02 (0.82) (0.93) (1.72) 12.32 5.94 10.34 (2.30) (0.99) (1.81) (B) Calculated from urinary excretion: (B) - (A) 0.75 Compound.' cafj•ine Vehicle: [(ethyleneglycol/triton x 100) (90/10)]/[H20] [50/50] n = 7 Arm (upper, outer) 6.04 (0.92) 6 Abdomen 3.76 (0.67) 7 Postauricular 5.87 (0.52) 6 Forehead 11.17 (1.20) 12.09 6.75 11.83 (1.84) (0.84) (1.53) 7.53 4.31 7.36 (1.34) (0.60) (1.11) ll.72 7.46 13.13 (1.05) (1.24) (2.26) 22.35 11.60 20.71 (2.39) (1.52) (2.79) (B) Calculated from urinary excretion: (B) - (A) 0.5 Compound.' benzoic acid Vehicle: (ethyleneglycol/triton x 100) (90/10) n = 8 Arm (upper, outer) 6.87 (0.75) 7 Abdomen 10.88 (1.23) 8 Postauricular 16.87 (3.85) 7 Forehead 20.10 (2.39) 9.15 5.70 9.90 (1.01) (0.58) (1.00) 14.51 7.89 13.92 (1.64) (1.12) (1.97) 22.49 10.53 18.75 (5.14) (0.63) (1.15) 26.80 13.20 23.63 (3.19) (2.70) (4.79) (B) Calculated from urinary excretion: (B) - (A) 0.75 Compound.' acetylsalicylic acid n = 7 Arm (upper, outer) 6 Abdomen 6 Postauricular Vehicle: (ethyleneglycol/triton x 100) (90/10) 5.27 17.00 11.99 21.42 (0.18) (0.37) (1.34) (2.45) 5.34 17.20 9.98 17.74 (1.03) (3.35) (1.98) (3.62) 11.04 29.2 14.56 26.10 (2.50) (5.37) (1.30) (2.38) (continued)

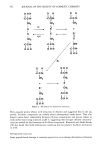
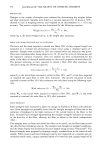
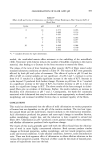
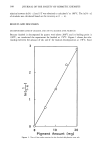
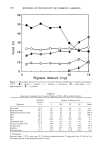
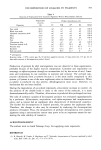
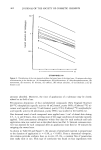
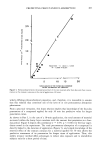
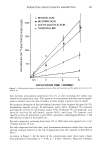
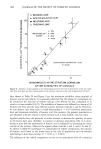
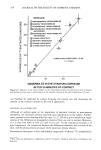
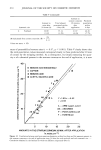
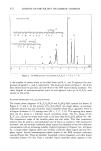
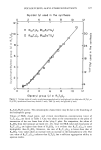
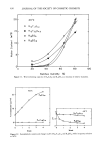
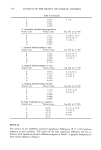
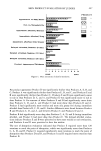
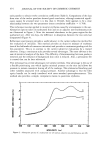
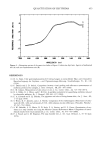
414 JOURNAL OF THE SOCIETY OF COSMETIC CHEMISTS Table V (continued) Anatomic site Amount in urine after 24 hours (A) Amount in stratum corneum Predicted Total amount 30 minutes penetration penetrated within after within 4 days (B) application 4 days 6 Forehead 10.89 35.14 21.97 40.20 (1.02) (3.29) (4.24) (7.75) (B) Calculated from urinary excretion: (B) - (A) 0.31 Values are mean _+ SD. ences of permeability between sites (r = 0.97, p 0.001). Table V clearly shows that the total penetration values measured correspond closely to those predicted after 30 rain of contact by the stripping method. As a consequence, by simply measuring the quan- tity x of a chemical present in the stratum corneum at the end of application, it is now 40- 3O 2O 10 B BENZOIC ACID SODIUM SALT O CAFFEIN ß BENZOIC ACID • ACETYL SALICYLIC ACID /' A AB F AB 1 I Y= 1.83 x -0.52 r =0.97 A = ARM (upper, outer) AB = ABDOMEN P • POST AURICULAR F = FOREHEAD I I 1 5 10 15 20 25 AMOUNTS IN THE STRATUM CORNEUM 30 MIN. AFTER APPLICATION ( n. moles.cm '2 ) Figure 12. Correlation between total percutaneous absorption within four days and the amounts present in the stratum corneum at the end of application time (30 min) for each molecule and each anatomic site. -- Correlation obtained in the hairless rat with ten different compounds (Part I).
Purchased for the exclusive use of nofirst nolast (unknown)
From: SCC Media Library & Resource Center (library.scconline.org)