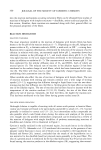
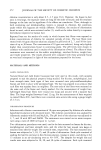
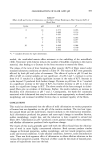
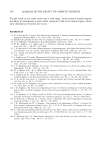
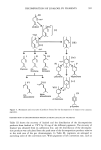
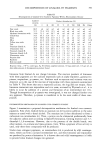
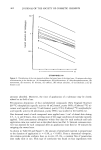
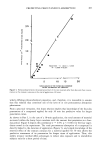
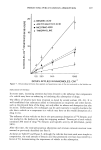
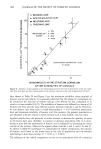
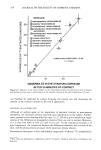
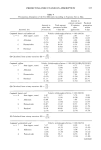
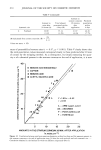
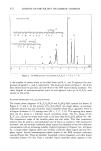
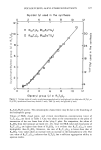
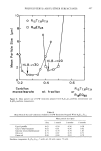
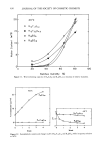
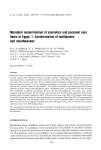
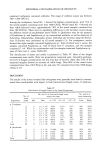
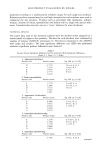
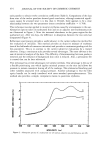
j. Soc. Cosmet. Chem., 38, 451-455 (November/December 1987) Quantitation of erythema by reflectance spectroscopy DANIEL M. CROWE, MARCIA S. WILLARD, and RICHARD I. MURAHATA, Department of New Science and Technology, Dial Technical Center, 15101 North Scottsdale Road, Scottsdale, AZ 85254. Received April 24, 1987. Synopsis A fiber optics bundle was added to a Pye-Unicam scanning spectrophotometer allowing its use in quanti- tating erythema in vivo. Standard chamber irritation test sites were evaluated subjectively by a trained observer and objectively by quantitating the relative absorption of green light (570-580 nm) due to the presence of the hemoglobin chromophore. There appears to be a good relationship between subjective erythema scores and spectrophotometric readings. Reflectance spectroscopy provides a valuable objective adjunct to the subjective evaluation of skin irritation. INTRODUCTION Erythema caused by ultraviolet irradiation or chemical irritation is commonly graded by a visual estimation of redness by a trained observer. This evaluation uses a discontinuous grading scale and is, by its subjective nature, often imprecise. It is most accurate for detecting threshold irritation, but not ideally suited for evaluating graded differences or for readings separated temporally (1,2). In order to remove the subjectivity and to provide a continuous scale of erythema values, we modified a scanning spectrophotom- eter to take reflectance values directly from the skin in vivo. The use of reflectance spectroscopy to determine skin color and erythema is not a new idea. Investigators have custom modified their own equipment (3,4), used a rather expensive integrating sphere (5,6), and used a tristimulus reflectance meter (7) to ex- amine erythema. We interfaced a fiber optics bundle with a Pye-Unicam spectropho- tometer. Initial studies demonstrated that the sensitivity of this technique was suffi- cient to distinguish among the entire range of subjective erythema scores (Figure 1). Note the increase in absorbance of green light (535-580 nrn) corresponding to the increase in the degree of erythema. The present study was designed to demonstrate the correlation between spectrophotometric measurements and' clinical evaluation of ery- thema. MATERIALS AND METHODS Twelve panelists (five males, seven females) participated in a modification of the 451

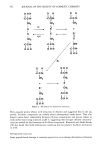
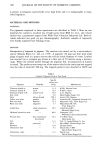
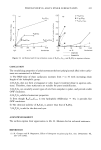
452 JOURNAL OF THE SOCIETY OF COSMETIC CHEMISTS .9' .8 .7 .6 I I I I I I I I ! I I I 'I I I 660 640 62• 600 580 560 540 520 WRVELENGTH Figure 1. Absorption spectrataken •om •ursites on asingle panelist. Erythemascores:(A) 3,(B)2,(C) 1,(D) 0. chamber irritation test (8). Informed consent was obtained from all subjects at the beginning of the study. They were tested for an irritancy response to three bar cleansers. Eight per cent solutions (w/w) in deionized water were prepared by heating to 40øC. The products were applied to the volar forearm according to a randomization table. One site remained untreated. The first occlusion was for 23 1/2 hours. The chambers were then removed and the sites were rinsed gently with tap water and blotted dry with a paper towel. Thirty minutes later the sites were scored for erythema using the following scale: 0 = no redness, 1 = slight redness, 2 = moderate redness, 3 = intense redness. The sites were then repatched for an additional five hours. The chambers were removed, rinsed, and scored as described above. After the second set of visual scores was assigned, light reflectance was measured using the modified scanning spectrophotometer (Figure 2). A bifurcated, mid-UV fiber optics bundle with a common leg diameter of 4 mm (Highlight Fiber Optics, Union City, CA) was attached to the spectrophotometer. The tip of the common leg of the optics bundle was placed against the volar aspect of the forearm using a flexible positioning arm. Light from the illumination side of the spectrophotometer was collected by one leg of the fiber optics bundle and directed onto the skin. Light reflected from the skin was returned to the photomultiplier through the other leg of the fiber optic. The instru- ment was interfaced with a MINC 11/03 minicomputer for data analysis. Spectrophotometric readings were taken between the wavelengths of 510 and 650 nm. The absorbance maximum fbr hemoglobin is in the green region of the spectrum. Thus, the relative absorbance for the red and green regions is related to the degree of erythema (4). The values used for the correlation were calculated as follows: adjusted absorbance = (G
Purchased for the exclusive use of nofirst nolast (unknown)
From: SCC Media Library & Resource Center (library.scconline.org)