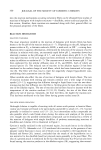
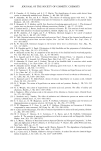
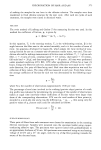
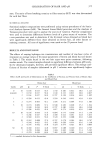
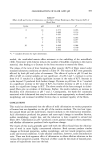
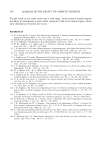
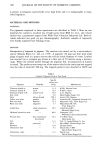
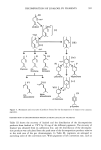
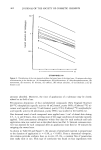
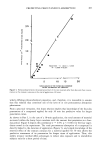
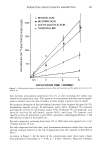
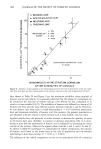
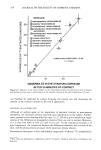
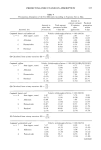
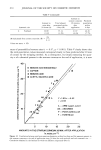
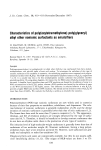
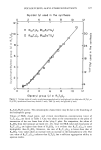
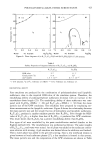
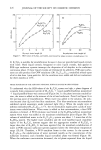
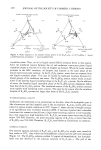
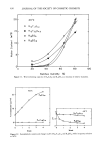
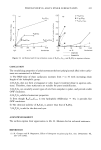
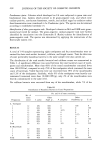
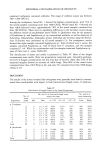
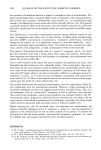
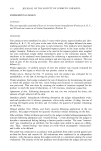
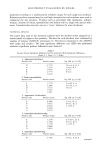
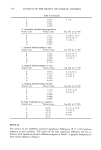
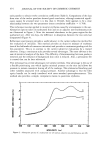
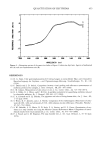
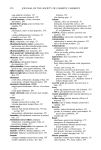
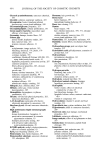
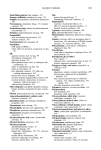
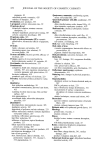
408 JOURNAL OF THE SOCIETY OF COSMETIC CHEMISTS 20- o o z z 15- 10- o BENZOIC ACID . ACETYLSALICYLIC ACID •, NICOTINIG ACID ., THEOPHYLLINE 1: 125 Nanornoles.cm '• 2: 250 applied 3: 500 4: 1000/4 14 ß ß 23 CORRELA]'ION COFFFICIEIN]' :.O.98 P 0.o01 i i :5 10 NANOMOLES INTHE STRATUM CORNEUM AFTER 30 MINUTES OF CONTACT Figure 8. Influence of dose applied on the relationship between the level of penetration of the test mate- rials after four days and their concentration in the stratum corneum at the end of application (30 rain). Also shown in Table IV and Figure 9 are the maximum solubility values (mg/ml) of benzoic acid in each vehicle. It is generally admitted that the release of a compound can be favored by the selection of vehicles having a low affinity for that compound or in which it is least soluble (24,25). The solubility of benzoic acid differed by a factor of 30 between the least and the most efficient solvent medium (vehicles 4 and 6). However, we can observe that there exists a weak relationship (r = 0.01) between penetration level and maximum solubility of benzoic acid. For instance, the greatest penetration is not obtained with the vehicle in which benzoic acid is least soluble, and vice versa. Applied vehicles have the potential to either increase or decrease the quantity of water in the horny layer and, therefore, to increase or decrease penetration (26). It is inter- esting to note that the penetration of benzoic acid is enhanced by increasing the water content of the vehicles, whatever the organic phase (vehicles 1 and 5, and 6, 8, and 9). As shown in Table IV and Figure 10, independent of vehicle composition, the amount of benzoic acid found in the horny layer at the end of application and the amount penetrating in four days correlate (r = 0.99, p 0.001). The influence of the vehicle composition on the in vivo penetration level of a chemical

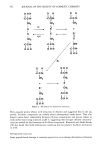
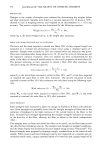
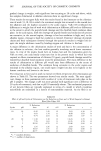
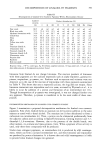
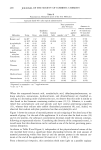
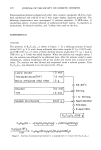
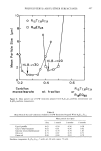
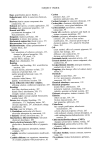
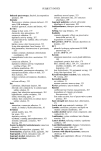
PREDICTING PERCUTANEOUS ABSORPTION 409 Table IV Effect of Vehicle Composition on Percutaneous Absorption of Benzoic Acid in the Hairless Rat Maximum Total amounts found 96 h after application solubility of benzoic Epidermis acid in + dermis the vehicles area Animal Total Vehicles (mg/ml) Urine Feces treated body penetration Amounts in stratum corneum of the treated area 30 min after application Propyleneglycol- 219.5 0.81 a 0.32 0.03 0 1.15 0.73 triton x 100 (90/10) (0.08) b (0.09) (0.007) (0.12) (0.07) Glycerol-triton 28.5 1.57 0.59 0.04 0 2.20 0.91 x 100 (90/10) (0.31) (0.27) (0.006) (0.44) (0.10) Ethyleneglycol- 130.5 4.18 0.38 0.12 0.02 4.71 3.10 triton x 100 (90/10) (0.74) (0.12) (0.05) (0.009) (0.85) (0.55) [(Ethyleneglycol- 6.5 4.45 0.48 0.16 0 5.10 3.91 triton X 100) (0.48) (0.14) (0.04) (0.51) (0.31) (90/10)]-[water] (40/60) [(Propyleneglycol- 17.5 8.61 0.80 0.38 0.03 9.81 4.41 triton X 100) (1.14) (0.23) (0.08) (0.01) (1.33) (0.23) (90/10)]-[water] (40/60) Ethanol-water 220 24.80 1.32 0.50 0.01 26.60 17.60 (95/5) (0.50) (0.30) (0.05) (0.004) (0.65) (1.50) Methanol-water 19 30.46 2.50 0.88 0.18 34.02 18.68 (40/60) (2.93) (0.47) (0.10) (0.10) (3.01) (1.86) Ethanol-water 148 43.42 3.98 1.02 0.09 48.52 23.56 (60/40) (3.97) (0.36) (0.27) (0.03) (3.57) (3.43) Ethanol-water 40 49.56 3.59 0.78 0.15 54.08 28.39 (40/60) (4.95) (0.39) (0.12) (0.02) (5.21) (1.73) Expressed in nanomoles ß cm -2 application area S.D.: (n = 6). ß [] i so- 200 • 4o- z_ 115o • 8 [ •oo _ o le=• 20- o• I so -• o ß ß D O I 2 3 4 5 6 ? 8 9 Figure 9. Comparative values of solubility of benzoic acid in the vehicles and corresponding percutaneous absorption levels. 1: propyleneglycol-triton x 100 (90/10). 2: glycerol-triton x 100 (90/10). 3: ethylene- glycol-triton x 100 (90/10). 4: (ethyleneglycol-triton x 100) (90/10)-water (40/60). 5: (propyleneglycol- triton x 100)(90/10)-water (40/60). 6: ethanol-water (95/5). 7: methanol-water (40/60). 8: ethanol-water (60/40). 9: ethanol-water (40/60).
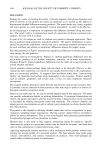
Purchased for the exclusive use of nofirst nolast (unknown)
From: SCC Media Library & Resource Center (library.scconline.org)