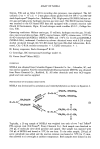
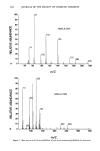
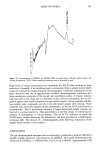
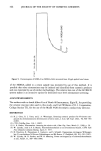
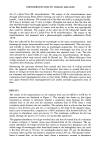
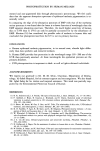
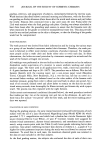
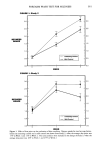
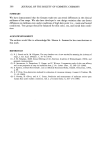
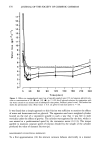
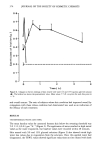
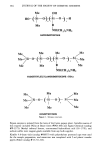
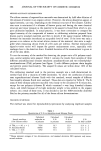
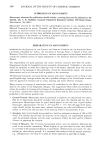
340 JOURNAL OF THE SOCIETY OF COSMETIC CHEMISTS 100_ 90- 8O 60- i 40- 30- I1"' 20 10 a o ..... '•b'" 87 74 NDELA-OAC 116 145 103[ 75 m/Z 100- 90- 80- z 7o- z 60- 133 50- i•• 40- 30- U.I r3 103 130 144 NDELA-TMS 0 263 100 150 200 300 D m/z Figure 7. Mass spectra of b/s-(O-acetyl)NDELA (a) and b/s-(O-trimethylsilyl)NDELA (b) derivatives.

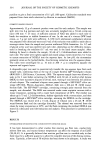
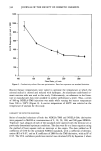
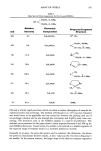
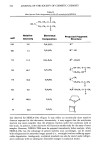
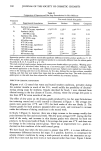
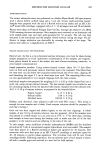
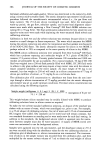
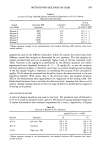
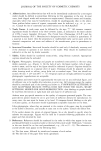
ASSAY OF NDELA 341 Table I Mass Spectral Peak Assignments for Bis-(O-acetyl)NDELA mlZ ON-N / CH2CH2-O-SiMe3 CH2CH2-O -SiMe3 Relative Elemental Proposed Fragment Intensity Composition Structure 263 9.7 C9H23N203Si 2 M•-CH3 232 8.0 C9H22NO2Si 2 146 21.0 C6H •6NOSi 144 39.0 C6H14NOSi 130 100.0 CsH12NOSi N 117 33.1 C4H11NOSi / CH2CH2-OSiMe3 CH-CH2-O =SiMe 2 I'•N •' CH2 CH2CH2-O•SiMe 3 //CH2 CH2CH2-O • SiMe2 o- __NH CH 3 %CH 3 103 59.2 C4H l!Osi CH 2 = O-SiMe 3 73 81.9 C3H9•i •)SiMe3 (26) and is a fairly rapid procedure which can allow a modest throughput of samples for industrial audits and screenings. The method of Fukunda et al. (47) was also evaluated and would seem to be applicable and less costly but involves the packing and use of ion-exchange columns and so was deemed less convenient and slightly more time-con- suming. The derivative used in the NDELA analysis is a matter of preference. The standard curve presented in this paper shows a linear response between 0 and 500 ng for each NDELA derivative. Construction of a similar curve limited to a smaller segment of the expected range of response results in a narrower prediction interval. Generally in an assay, the more data points used to construct the calibration, the better the power to discriminate between results, as the t value and the 1/n term in Equation 3 are smaller. In the present instance, the larger slope of the detector response regression
Purchased for the exclusive use of nofirst nolast (unknown)
From: SCC Media Library & Resource Center (library.scconline.org)