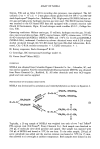
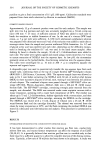
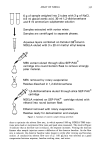
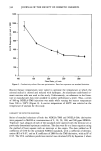
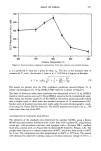
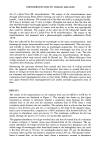
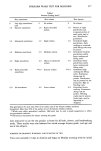
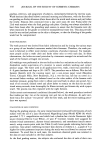
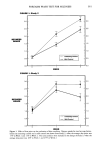
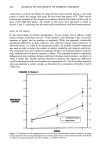
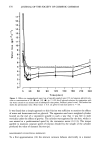
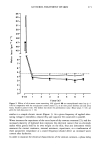
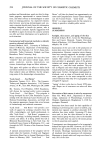
336 JOURNAL OF THE SOCIETY OF COSMETIC CHEMISTS 1200 1000- 800- 400- 200 - 100 - 0 I I I I 100 150 200 2•0 300 Flow Rate: # L/min Figure 3. Conductivity solvent flow rate optimization. Error bars represent one standard deviation. Reactor furnace temperatures were varied to optimize the temperature at which the nitrosyl radical is cleaved and reduced with hydrogen. An aluminum oxide-based ce- ramic reaction tube was used in this study. Unfortunately, no references in the litera- ture or manufacturer data were available to predict performance a priori. Thus, a series of 100-ng NDELA-TMS injections was made while varying the reactor temperature from 500 to 700øC (Figure 4). A reactor temperature of 600øC was selected as the temperature of analysis for this study. LINEARITY OF DETECTOR RESPONSE Series of standard solutions of both the NDELA-TMS and NDELA-OAc derivatives were prepared in MeOH at concentrations of 2, 10, 50, 100, and 500 ppm NDELA. Triplicate 1-•L aliquots of each of the standards were injected with the detector set at previously determined optimum conditions. The data were fit to a linear equation using the method of least squares with an intercept at the origin. The data yielded an X coefficient of 4150 for the acetylated NDELA standaMs, with a coefficient of determi- nation (R 2) of 0.97, and an X coefficient of 2880 for the TMS derivative, with an R 2 of 0.95. The 95% confidence prediction interval was calculated (45) by Equation 3 where

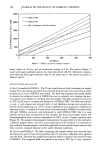
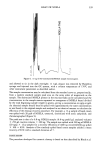
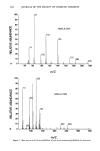
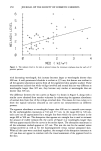
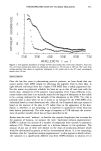
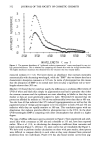
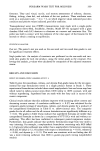
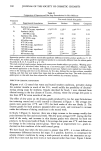
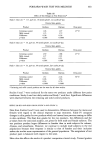
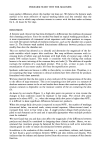
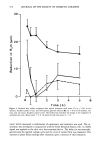
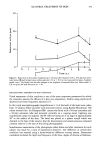
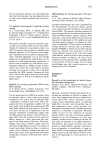
ASSAY OF NDELA 337 550 450" 400- 350- 300 I I I I 50O 550 6OO 650 7OO Furnace Temperature øC Figure 4. Reaction furnace temperature optimization. Error bars represent one standard deviation. Yc is a predicted Y value for a given X value, Xp. The Sy:x is the standard error of estimate for Y, and t, the Student t value at ot = 0.05 for n-2 degrees of freedom. y, _ t(•_a/2)Sylx J'l + 1 + (xp -- .•)2 • '5',(xi- •)2 (3) The results are plotted with the 95% confidence prediction interval (Figure 5). A sample chromatogram of a 10-ng NDELA-TMS injection is shown in Figure 6. The limit of detection under these conditions was determined to be 0.25 ng NDELA eluted as the his-acetate ester and 0.38 ng NDELA eluted as the bis-trimethylsilyl ester, these being the absolute quantities of the NDELA derivatives producing peaks which have a height equal to three times the standard deviation of 16 measurements (46). Similar series of standard injections were made under the same chromatographic condi- tions using the Varian FID for detection. The ELCD response was found to be ca. 250 times more than that of the FID. CONFIRMATION OF STANDARDS: MASS SPECTRA The identities of the standards were determined by capillary GC/MS, using a Kratos MS-80 mass spectrometer interfaced with a Carlo Erba 4160 capillary GC using helium carrier gas, cold on-column injection, and equipped with a 30-meter DB-5 capillary fused silica column with a 0.25-1xm film thickness (J&W Scientific, Folsom, CA). The samples were injected at a column temperature of 60øC, which was then raised to 100øC for 3 min. The temperature was then programmed to 260øC at 10øC/min. The spectra were obtained by repetitive scanning using an electron ionization voltage of 50 ev, a
Purchased for the exclusive use of nofirst nolast (unknown)
From: SCC Media Library & Resource Center (library.scconline.org)