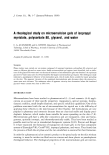
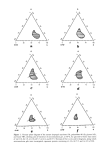
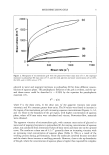
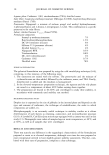
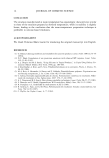
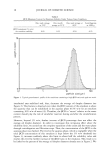
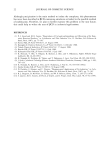
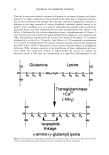
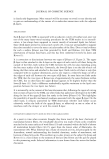
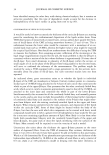
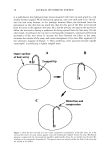
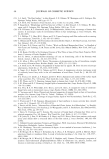
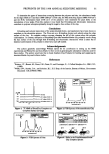
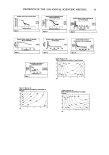
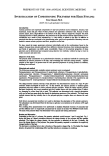
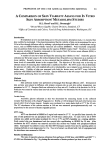
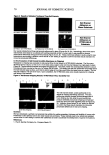
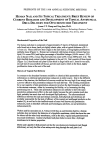
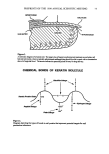
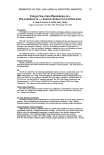
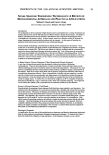
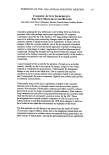
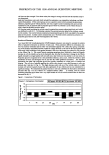
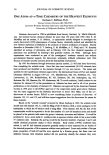
o o •{, , , , , , , , , , , , • • , .... •- -•/, , , .... , ...... o 2• so 7• lOO o • ,o • •oo •+w • s •+w • 0 25 50 75 100 0 25 50 75 100 G+W e s G+W f s Figure 1. Ternary phase diagram of the system isopropyl myristate (O), polysorbate 80 (S), glycerol (G), and water (W), showing area of existence of microemulsion gel, at 40øC, for glycerol-to-water mass ratios of: (a) 0:10, (b) 1:9, (c) 2:8, (d) 3:7, (e) 4:6, and (f) 5:5. Tie-lines of the (c), (d), and (e) diagrams, along which microemulsion gels were investigated, represent systems containing (c) 4:6, (d) 5:5, and (e) 4:6 of O:S.

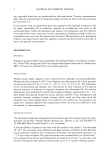
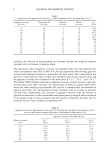
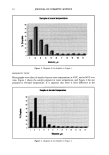
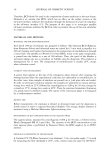
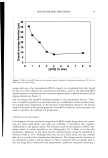
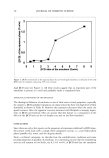
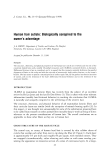
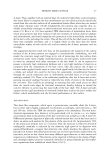
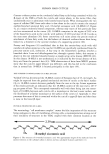
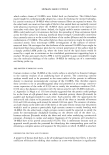
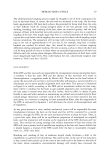
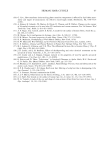
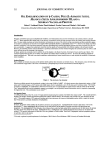
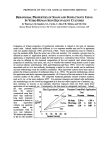
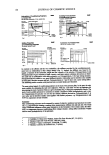
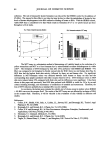
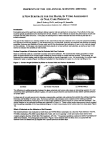
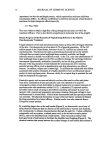
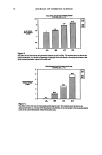
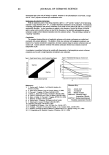
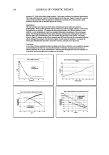
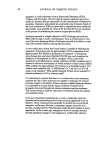
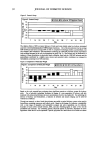
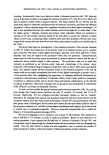
MICROEMULSION GELS 5 2000 1500 1000 500 (c) (b) (a) 0 500 1000 1500 Shear rate (s 4) Figure 2. Rheograms of microemulsion gels with the glycerol-to-water mass ratio of 3:7, the isopropyl myristate to polysorbate 80 mass ratio of 5:5, and the total glycerol and water concentration of: (a) 20%, (b) 30%, and (c) 40% w/w at 37øC. glycerol to water and isopropyl myristate to polysorbate 80 for three different concen- trations of aqueous phase. The pseudoplastic behavior of the gels is evident, and the up- and down-curves could be described (r 0.990) by the equation for pseudoplastic materials (15), F N = •'G where F is the shear stress, G the shear rate, •1' the apparent viscosity (one point viscosity), and N a constant greater than unity. The N values were found to increase in the region of microemulsion gel with increasing aqueous concentrations (Figures l c, ld, and le). Close to the boundary of the gel region, with higher concentration of aqueous phase, values of N near unity were calculated and viscous, Newtonjan-flow, materials were obtained. The apparent viscosity of microemulsion gels, with constant mass ratios of glycerol to water and of isopropyl myristate to polysorbate 80, for varying concentration of aqueous phase, was calculated from determined values of shear stress and shear rate on the upward curve. The results at a shear rate of 4.2 s -1 generally show an increasing viscosity with an increasing total concentration of aqueous phase (Table I). This is a result of the swelling process during gel formation, where the molecules involved become stretched and the elastic forces increase as swelling proceeds. However, close to the up-boundaries of the gel, where the concentration of aqueous phase is higher than required for complete
Purchased for the exclusive use of nofirst nolast (unknown)
From: SCC Media Library & Resource Center (library.scconline.org)