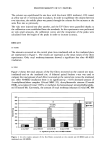
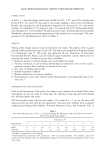
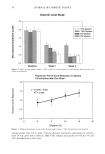
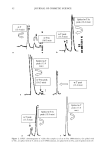
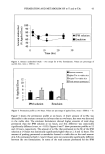
16 JOURNAL OF COSMETIC SCIENCE quantity of 40 pl of product was applied to each skin site in a randomized design, with one skin site serving as an untreated control. MEASUREMENT SETTINGS All measurements were conducted in controlled temperature and humidity conditions (22 + 2øC and 45 _+ 5% relative humidity). Subjects acclimated to the room conditions during a 20-minute equilibration period prior to each set of measurements. The data were collected at baseline, one hour and two hours after application of the products. STATISTICAL ANALYSIS Statistical analysis was performed with SAS for Windows © 6.12 package. PROC GLM, PROC CORR, and PROC REG were the main procedures used to analyze the data and select suitable models. Options for multiple comparison of means of different groups were used. RESULTS AND DISCUSSION The results are given with the respective means, standard deviations, and significance levels in Table II (a-c) and are illustrated in Figure 1. PROC GLM procedures were used to compare the means of the different measurement modes (baseline, one-hour, and two-hour), salt levels, and glycerin levels. In general, there was very good agreement among the three instruments, with some differences. A small but statistically significant difference (P 0.05) was observed between baseline measurements on the untreated site and those at the one-hour and two-hour time points with the Nova © and the Skicon ©, but not with the Corneometer ©. Table IIa Summary of Measurements by Nova © DPM 9003, at Baseline, and at One Hour and Two Hours After Using the Emulsions P-value Nova © DPM 9003 Mean capacitance ñ SD Baseline Baseline 1 Hour Glycerin vs vs vs (%) NaC1 Emulsion Baseline 1 Hour 2 Hours 1 hour 2 hours 2 hours 0 1 100 +_ 8 131 _+ 40 128 ñ 36 0.001 0.003 0.79 0 1.5 2 101 _+ 9 123 _+ 20 124 _+ 24 0.000 0.000 0.86 3 3 103 _+ 9 114 ñ 14 113 _+ 14 0.003 0.008 0.76 0 4 102 _+ 9 201 _+ 17 191 +_ 69 0.0001 0.0001 0.55 5 1.5 5 102 _+ 9 258 _+ 79 231 _+ 75 0.0001 0.0001 0.16 3 6 102 _+ 9 218 _+ 76 209 _+ 77 0.0001 0.0001 0.63 0 7 103 ñ 8 234 _+ 55 234 _+ 51 0.0001 0.0001 0.96 10 1.5 8 101 ñ 8 340 _+ 78 314 _+ 74 0.0001 0.0001 0.17 3 9 100 _+ 7 313 ñ 67 229 ñ 74 0.0001 0.0001 0.42 Control 100 _+ 8 112 _+ 16 111 _+ 13 0.002 0.006 0.74

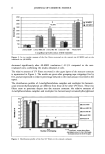
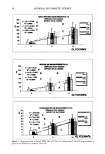
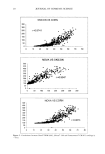
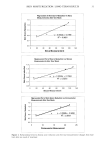
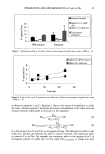
SKIN MOISTURIZATION: SHORT-TERM MEASUREMENTS 17 Table IIb Summary of Measurements by Skicon © 200 at Baseline and at One Hour and Two Hours After Using the Emulsions Skicon © Mean conductance + SD Glycerin (%) NaCI Emulsion Baseline 1 Hour 2 Hours P-value Baseline Baseline l Hour VS VS VS 1 hour 2 hours 2 hours 0 1 13 + 13 37 + 33 34 ñ 26 0.002 0.008 0.63 0 1.5 2 15 _+ 12 28 ñ 15 27 + 14 0.002 0.005 0.75 3 3 14 + 8 17 _+ 9 18 _+ 8 0.323 0.20 0.78 0 4 14 + 7 75 + 42 74 _+ 42 0.0001 0.0001 0.91 5 1.5 5 13 + 9 109 _+ 58 92 -+ 47 0.0001 0.0001 0.18 3 6 13 ñ 7 73 + 38 77 _+ 44 0.0001 0.0001 0.68 0 7 13 + 8 111 ñ 39 117 + 37 0.0001 0.0001 0.50 10 1.5 8 13 ñ 9 181 + 51 167 _+ 63 0.0001 0.0001 0.30 3 9 12 + 7 149 + 65 142 + 60 0.0001 0.0001 0.65 Control 14 _+ 9 25 + 14 24 ñ 11 0.001 0.004 0.70 Table Ilc Summary of Measurements by Corneometer © CM 825 at Baseline and at One Hour and Two Hours After Using the Emulsions P-value Corneometer © Mean capacitance ñ SD Baseline Baseline 1 Hour VS VS VS Glycerin (%) NaCl Emulsion Baseline 1 Hour 2 Hours 1 hour 2 hours 2 hours 0 1 26 _+ 8 34 ñ 11 34 + 12 0.007 0.005 0.88 0 1.5 2 27 + 7 32 + 8 33 + 8 0.019 0.012 0.86 3 3 27 + 7 29 + 7 29 -+ 6 0.42 0.29 0.80 0 4 27 + 7 45 + 11 44 + 11 0.0001 0.0001 0.71 5 1.5 5 27 + 7 48 + 12 47 + 11 0.0001 0.0001 0.56 3 6 27 + 7 42 + 9 43 ñ l0 0.0001 0.0001 0.83 0 7 27 + 6 49 ñ 9 49 + 10 0.0001 0.0001 0.96 10 1.5 8 27 + 6 57 + 8 54 _+ 10 0.0001 0.0001 0.27 3 9 26 + 6 51 ñ 10 50 + 10 0.0001 0.0001 0.82 Control 27 + 7 30 + 8 29 + 8 0.20 0.22 0.95 This probably reflects a small increase in hydration of the skin surface during the time between baseline reading and the one-hour reading, in spite of the 20-minute equili- bration time prior to measurement. The fact that it was seen only with the Nova © and the Skicon © agrees with the observation of Clarys eta/. (11) that the Nova © and Skicon © are more sensitive to changes at the very surface of the skin than is the Corneometer ©. For the 3% NaC1 and 0% glycerin formulation, the one- and two-hour readings with the Nova © DPM were significantly different from baseline, whereas the readings with the Skicon © and the Corneometer © were not significantly different from baseline. The correlation between the instrumental reading and the glycerin concentration was calculated and plotted for all three devices at each salt level (Figure 1). Strong linear
Purchased for the exclusive use of nofirst nolast (unknown)
From: SCC Media Library & Resource Center (library.scconline.org)