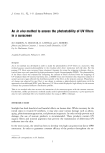
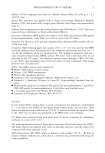
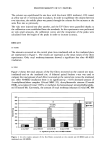
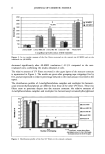
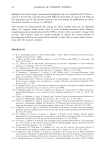
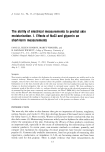
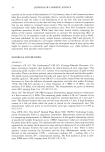
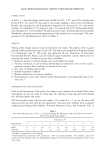
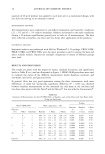
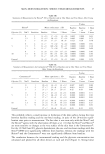
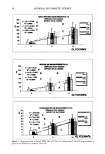
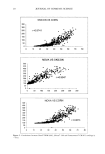
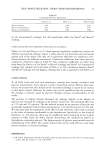
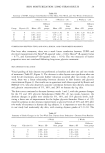
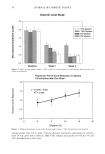
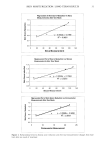
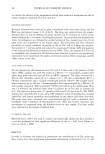
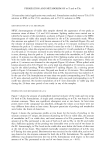
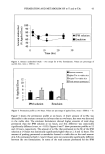
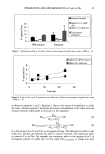
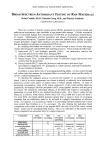
PERMEATION AND METABOLISM OF c•-T and c•-TAc 43 100 n • • 90 •o • 80 ==-- 70 5 • 60 • • 50 40 0 10 20 30 Time (hrs) ß IPM solution! I Emulsion Figure 3. Amount unabsorbed (wash + two strips) for ot-TAc formulations. Values are percentage of applied dose, mean + SEM (n = 4). 12n I 8 10q --• 6 • • 2 IPM solution Emulsion ß Stratum comeurn [] alpha-TAc in viable skin [] AIpha-T in viable skin [] Total amount permeated Figure 4. Permeation profile at two hours. Values are percentage of applied dose, mean + SEM (n = 4). Figure 5 shows the permeation profile at six hours. A lower amount of c•-TAc was detectable in the stratum corneum at six hours than at two hours, but more was detected in the viable skin. The emulsion formulation showed higher amounts of total drug permeated than the IPM solution at six hours, and this difference was statistically significantly different (t-test, c• = 0.05). Figures 6 and 7 show permeation profiles at 12 and 24 hours, respectively. The amount of c•-TAc that permeated in the SC of the IPM solution at 24 hours was statistically significantly higher than at 2, 6 and 12 hours. The amount of prodrug permeated or metabolite formed in viable skin or the total amount of c•-TAc permeated at both 12 and 24 hours were not statistically significantly different between the two formulations. In terms of the total amount permeated for the IPM

44 JOURNAL OF COSMETIC SCIENCE 12• 10 t I 84 i T IPM solution Emulsion ß Stratum Comeurn '• a!pha-TAc in viable skin [] alpha-T in viable skin []Total amount permeated Figure 5. Permeation profile at six hours. Values are percentage of applied dose, mean _+ SEM (n = 4). 10- '- c• 4 •' 2 0 3' -•_•:.• 1 IPM solution Emulsion ß Stratum Corneum [] alpha-TAc in viable skin []alpha-T in viable skin Total amount permeated Figure 6. Permeation profile at 12 hours. Values are percentage of applied dose, mean + SEM (n = 4). solution, the amount at 24 hours was significantly higher than that at two and six hours. The total amount permeated in this case probably reaches a plateau at six hours and does not significantly increase after that. Total ot-TAc and ot-T permeated in viable skin was significantly higher in the ot-TAc emulsion at 24 hours and six hours than at two hours. The emulsion had higher amounts of metabolite at 12 hours, although at the end of the study period (24 hours), there was no significant difference between the two formula- tions in terms of the amount of metabolite ot-T formed in viable skin. Figure 8 shows the total ot-TAc and ot-T in viable skin. The figure depicts the gradual increase in deposition of both compounds into viable skin with time, as shown by its linear profile. The extent of metabolism (EX, %) has been calculated in the viable skin and total skin
Purchased for the exclusive use of nofirst nolast (unknown)
From: SCC Media Library & Resource Center (library.scconline.org)