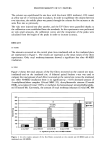
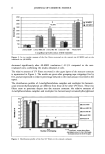
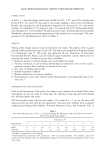
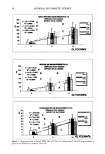
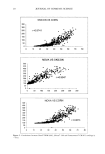
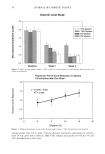
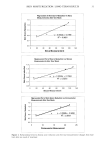
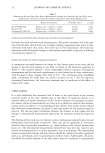
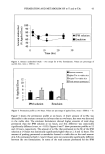
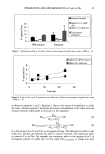
26 JOURNAL OF COSMETIC SCIENCE and after two weeks (14 days) of treatment. Note that the measurements were made 12-18 hours after the treatments had been applied on the previous evening. Instrumen- tal measurements were taken with the Nova © DPM 9003, the Skicon © 200, the Cor- neometer © CM 825, and the DermaLab © evaporimeter. Grading was performed in a double-blind fashion by a trained grader at baseline, one week and two weeks after treatment at the same time as the instrumental measurements. The grading scale for dryness/scaling is shown in Table I (14). ENVIRONMENTAL CONDITIONS All measurements were conducted under controlled temperature and humidity condi- tions (22 + 2øC and 45 + 5% relative humility) according to the guidelines for stan- dardized hydration measurement (1). The subjects acclimated to the room conditions for at least 30 minutes before any measurements were made. STATISTICAL ANALYSIS All statistical work was completed with SAS for Windows © 6.12 package. PROC REG, PROC CORR, and PROC GLM with options of Student t-test and Scheffe and Duncan multiple comparisons were used in analysis of the data. RESULTS AND DISCUSSION ELECTRICAL MEASUREMENTS Electrical measurements at one hour, one week, and two weeks are reported in Table II. Significant increases (p 0.0001) in readings relative to baseline were observed after one hour, one week, and two weeks of glycerin treatment with all three devices. All of the differences were significant relative to baseline. The one-hour measurements demonstrated the largest increase in readings, and the two-week measurements showed the lowest. It should be pointed out that the readings at one and two weeks were taken at least 16 hours after the last application of moisturizer. Therefore, they reflect the long-term effects on the skin rather than the short-term effects of the lotion. There was a linear increase in readings with glycerin concentration after one hour of treatment with all three devices, corroborating the findings reported in Part I. The relationships at one week were also linear for each device, as shown in the regression plots (Figure 1). TRANSEPIDERMAL WATER LOSS TEWL was significantly lower than baseline one hour after application for all glycerin levels, including the 0% glycerin control (Table III). A weak linear relationship was observed between the extent of the TEWL reduction and the glycerin concentration (R-squared value = 0.8054). These results are consistent with those of Bart et al., who reported significant reduction in TEWL one hour after application of 5% and 15% aqueous glycerol solutions (16).

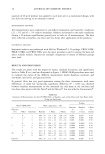
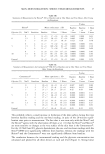
SKIN MOISTURIZATION: LONG-TERM RESULTS 27 Table II Summary of Electrical Measurements by Nova © DPM 9003, Skicon © 200, and Come©meter © CM 825 at One Hour, One Week, and Two Weeks after Glycerin Treatment Nova measurement (AU): Difference from baseline 1 Hour 1 Week 2 Weeks Different Different Different from from from Group Glycerin (%) Mean _+ SD groups Mean _+ SD groups Mean _+ SD groups A 0 37-+28 B,C,D 20_+ 19 C,D 12_+ 12 D B 5 148 _+ 72 A, C, D 51 ñ 49 D 25 ñ 19 -- C 10 237 _+ 99 A, B 97 -+ 115 A 33 -+ 49 -- D 15 267 _+ 110 A, B 118 _+ 115 A, B 51 _+ 72 A Skicon measurement (pS): Difference from baseline 1 Hour 1 Week 2 Weeks Different Different Different from from from Group Glycerin (%) Mean _+ SD groups Mean _+ SD groups Mean _+ SD groups A 0 12_+14 B,C,D 22_+22 C,D 18ñ 13 B,C,D B 5 85 -+ 62 A, C, D 61 _+ 48 D 42 -+ 24 A C 10 183 -+ 110 A, B, D 107 _+ 116 A 49 _+ 39 A D 15 250 _+ 130 A, B, C 130 _+ 143 A, B 54 _+ 45 A Corneometer measurement (AU): Difference from baseline 1 Hour 1 Week 2 Weeks Different Different Different from from from Group Glycerin (%) Mean _+ SD groups Mean _+ SD groups Mean _+ SD groups A 0 3_+4 B,C,D 8_+9 C,D 7_+9 D B 5 16_+9 A,C,D 15ñll D 14_+10 -- C 10 25 -+ 12 A, B 19 _+ 12 A 14 _+ 11 -- D 15 27 -+ 12 A, B 23 -+ 13 A, B 17 _+ 13 A One week after twice-daily treatment with the formulations, TEWL was significantly lower than the baseline values prior to the first application of 5%, 10%, and 15% glycerin. The 0% glycerin control was not different from baseline. However, the barrier response to glycerin, as indicated by TEWL, was not linear with concentration. After two weeks of treatment, the TEWL for the 0% glycerin control was significantly higher than at baseline prior to formula applications. Relative to the 0% glycerin control, the change from baseline TEWL value for the 5% glycerin formula was sig- nificantly lower than that for the 0% control, while the changes for the 10% and 15% levels were not different. The TEWL measurements after two weeks of treatment did not follow the pattern in the one-hour and one-week measurements. The TEWL values for the glycerin-containing formulations were not significantly different from baseline. The largest overall change was 2.0 g/m2/hr, a relatively small change for the TEWL param- eter. All TEWL values indicated normal barrier function.
Purchased for the exclusive use of nofirst nolast (unknown)
From: SCC Media Library & Resource Center (library.scconline.org)