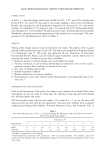
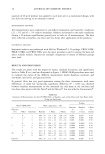
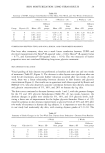
CATIONIC POLYMERS 5 5 obtained. A Brookfield KU-1 viscometer was employed to monitor viscosity and to provide constant mixing. The amount of the SDS required to gel 100 grams of 1% polymer solution is recorded in Table II. The coacervate gel in this study is slightly surfactant-deficient because the charge-neutral polymer-surfactant complex would pre- cipitate out of solution. Polymer solutions and the complex gels were drawn down on Form 3B Leneta opacity charts using a 3-mil Leneta multi-purpose drawdown bar (both from the Leneta Com- pany). The films were dried in a controlled-temperature and controlled-humidity room at 72øF and 50% relative humidity. The thickness of the dried films was relatively uniform at approximately 0.5 rail as measured by a Randall & Stickney gauge. TEST METHODS Gloss. The specular gloss observed from a sample is the relative luminous reflectance factor in the mirror direction. The test method is expressed in Equation 1. It involves measuring the ratio of the intensity of a reflected/specular beam of light (I r) from a polymer film to the intensity of the incident beam (Ii) and comparing this value with that of a standard black surface of known reflective index (12,13). (I/Ii)polymer (I•)po•ymer G= x 100- x 100 (1) (I•/Ii),tanda•d The specular gloss of polymer films on the black section of 3B Leneta charts was measured with a BYK-Gardner micro-TRI-gloss meter (model GB-4520) at 20 ø, 60 ø and 85 ø incident angles. The measuring fields for 20 ø, 60 ø, and 85 ø angles were 9 x 9 mm, 9 x 18 mm, and 7 x 42 mm, respectively. The multi-angle glossmeter was calibrated with a black gloss standard (GB-4522 20ø: 92 60ø: 95 85ø: 99) built in the holder. For each angle, the averaged gloss and standard deviation of six readings were recorded. Good reproducibility was obtained for polyquaternium-10 and cationic guar films, as the standard deviation was typically within +2 gloss units. The black section of the same 3B Leneta chart served as the control. Opacity, Opacity is the power of a polymer film to hide what is behind it. The contrast ratio method for the opacity measurement is described in several published test methods (ASTM D2805-80, TAPPI T425). This test measures the ratio of the reflectance of a dry film over a white backing to that of the sample applied over a black backing (14). A Hunter Tristimulus colorimeter (ColorQuest 45/0) and 3B Leneta opacity charts were used in our study. The opacity was measured as the ratio of the Y value (whiteness) of Table II Coacervate Formation by Addition of SDS to 100 Grams of 1% Polymer Solution Polymer % Polymer SDS KU [SDS]/[N +] PQlO (L/H) 1.01 0.1934 104 0.538 PQlO (M/H) 1.00 0.2004 110 0.571 PQ10 (M/M) 1.00 0.1380 87 0.704 PQlO (M/L) 1.00 0.1088 63 1.02 Guar (H/H) 1.00 0.1243 58 -- Guar (L/H) 1.00 0.0814 101 --

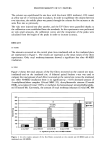
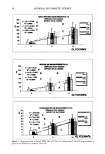
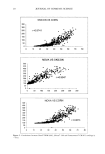
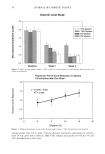
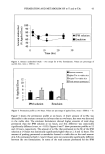
56 JOURNAL OF COSMETIC SCIENCE polymer drawdown film on the white section of the 3B opacity chart to that on the black section. Coefficient of friction. The coefficient of friction for polymer over polymer was measured on an Instrumentors slip/peel tester (SP-101A) under a 250-gram load per the procedure described in ASTM D1894. A film of 2.5" by 2.5" was cut from the Leneta chart and taped onto the sled. The remaining film on the same Leneta chart was taped on the platform. The horizontal sliding speed was set at 6"/rain, and all measurements were taken at controlled temperature and humidity. The frictional force was recorded as the platform traveled to the left. The measurements were repeated three times for each polymer, and the standard deviation was less than 0.005. Microscopic examination. The surfaces of the drawdown films were examined in a Hitachi S-570 scanning electron microscope (SEM) using an accelerating voltage of 15 KV after depositing a thin Au/Pd conductive coating. Both topographic and phase images were collected on a Digital Instruments D-3000 Nanoscope Ilia AFM in a tapping mode using a 100 pm silicone cantilever tip operating at -245 kHz. RESULTS AND DISCUSSION GLOSS Gloss depends not only on the material properties but also on process variables. A number of factors, such as index of refraction, viscosity, thickness, and film drying environment (i.e., temperature and humidity), can affect gloss. The thickness of dried films and the film-drying environment have to be carefully controlled. In this study, the wet-film thickness was controlled by the gap of the drawdown applicator while the dry-film thickness was determined by the solution concentration. Diminution of gloss arises primarily from surface imperfection and roughness. This causes light to be reflected at angles slightly offset from the specular angle. It has been found that the detection of minor imperfections is more sensitive at low incidence angles. The polyquaternium-10 samples all formed glossy films, with their 60 ø gloss readings higher than 70. Therefore, it is more appropriate to compare the 20 ø readings for such high-gloss films. Figure 1 shows the 20 ø gloss readings of cationic polymer films air-dried in the con- trolled temperature and humidity lab. It was noted that the gloss is not dependent on the molecular weight or cationic substitution of polyquaternium-10. The four polyquaternium-10 films all gave gloss values higher than 45, confirming shiny, glossy surfaces from the visual inspection. In contrast to smooth, shiny polyquaternium-10 films, guar (H/H) formed a hard, grainy film. A low-gloss reading of 12 was obtained on the guar films as a result of the roughness. Guar (L/H), a hydroxypropyl guar hydroxypropyl trimonium chloride, formed a shinier and more transparent film than guar (H/H). However, the result on guar (L/H) only represents approximately half the gloss of polyquaternium-10 films. The 3B Leneta chart control substrate as supplied is sealed with a high-gloss coating as shown by the data in Figure 1. A higher gloss value of cationic polymer film indicates that the polymer enhances the shine of the substrate. To the contrary, a low-gloss
Purchased for the exclusive use of nofirst nolast (unknown)
From: SCC Media Library & Resource Center (library.scconline.org)