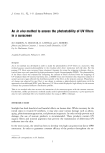
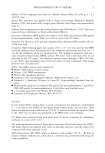
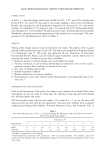
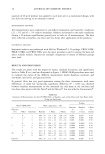
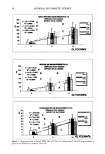
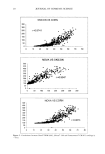
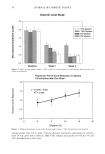
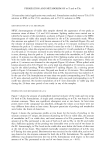
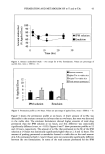
30 JOURNAL OF COSMETIC SCIENCE Glycerin Level Study •y777/-• 10% Glycerin T • 5% Glycerin • 0% Glycerin T T 2.5 2.0 1.5 1.o 0.5 o,o Baseline Week 1 Week 2 Figure 2. Skin dryness grades (mean +_ SE) vs glycerin concentration at baseline and after one and two weeks of treatment. Regression Plot of Score Reduction vs Glycerin Concentration after One Week 2.0 1.0 0.5 0.0 y = 0.0378x + 0.844 R 2 = . i i i i -5 0 5 10 15 20 Glycerin (%) Figure 3. Relationship between one-week dryness grades (mean _+ SE) and glycerin concentration. average grades were 0.5 at week 2 for the glycerin treatments, indicating the achieve- ment of very good skin condition. Half of the subjects had grades of 0 for the 5% and 10% formulations at this time.

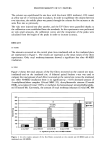
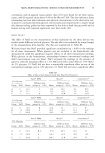
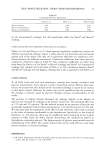
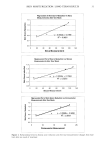
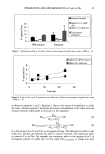
SKIN MOISTURIZATION: LONG-TERM RESULTS 31 Regression of Skin Score Reduction Vs Nova Measurements after One Week 1.1 0.9 0.7 0.5 y = 0.0053x + 0.7366 R 2 0.9651 = 2O 40 60 80 100 120 140 Nova Measurement Regression Plot of Score Reduction vs Skicon Measurement after One Week __•• . y = 0.0046x + 0.7684 R 2 = 0.9241 20 40 60 80 100 120 140 Skicon Measurement 1.3 1.1 0.9 0.7' 0.5 Regression Plot of Skin Score Reduction vs Corneom eter Measurement after One Week • y = 0.0368x + 0.5656 •'"""""""""• R 2 = 0.8757 5 10 15 20 25 Corneometer Meaurement Figure 4. Relationship between dryness score reduction and electrical measurements (changes from base- line) after one week of treatment.
Purchased for the exclusive use of nofirst nolast (unknown)
From: SCC Media Library & Resource Center (library.scconline.org)