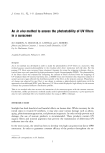
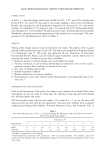
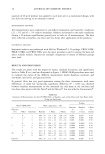
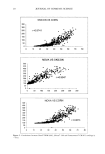
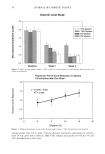
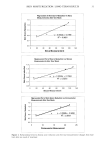
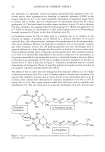
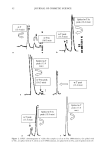
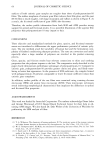
18 JOURNAL OF COSMETIC SCIENCE NOVA DPM.9003 MEASUREMENTS(1H) Diffef9nce from baseline y = 10x + 37.000 ,• EFFECT OF GLYCERIN •=o.ssss B T [. ....o, NACL y = 21.7x +30.500 B . I ........, 0 5 10 GLYCERIN% 3OO 250 2OO 150 100 5O 0 SKICON 200 MEASUREMENTS(1H) y = 7.4x + 24.33' 0.9996 A EFFEC'r OF GLYCERIN y =15.5x +14.833 B B y= 13.4x- 1.000 •::.: o 5 lO , ,0% NACL • 1.5% NACL ..... -.- 13.0• NACL GLYCERIN% 45 35 25 I 15 ,, 0+• CORNEOMETER 825 MEASUREMENT (1H) Difference from baseline y = 1.4x+9.000 EFFECT OF GLYCERIN R 2 = 0.9423 A y = 2.4x+7.000 S R 2 = 0.9796 S y= 2.3x +2.50 •=o.i•4 C. 'r r o 5 , ',0% NACL m 1.5% NACL lO Figure 1. Regression plots of Nova © DPM, Skicon © 200, and Corneometer © CM 825 measurements vs glycerin concentration at different salt levels.

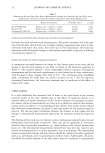
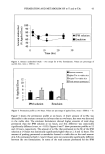
SKIN MOISTURIZATION: SHORT-TERM MEASUREMENTS 19 correlations with R-squared values greater than 0.94 were found for all three instru- ments, with R-squared values above 0.99 for the Skicon © 200. The data indicate a linear relationship between skin hydration and glycerin concentration in the short-term test. A positive correlation between glycerin concentration and improvement in expert visual skin dryness/scaling grades has been reported for dry skin in both the pig model and in human testing with repeated application over four weeks (16). EFFECT OF SALT The effect of NaC1 on the measurement of skin hydration by the three devices was studied under different levels of glycerin. The salt effect was evaluated by using changes of the measurements from baseline. The data are summarized in Table III. We have found that NaC1 provided significant contribution (p 0.05) to the readings for all three instruments. When glycerin was not included in the formulations, salt demonstrated small but significant negative effects on all three instrumental readings. With glycerin in the formulations, relationships between instrumental readings and NaC1 concentration were not linear. NaC1 increased the readings in the presence of glycerin, with the maximum effect at 1.5% NaCl and with a lesser effect at 3.0% NaC1. At 5% glycerin, 3% NaC1 did not have a statistically significant effect on any of the instrumental readings, and at 10% glycerin, 3% NaC1 did not have a significant effect Table III Effect of Salt at Each Glycerin Level One Hour Post-Treatment Nova © DPM Skicon © Corneometer © 0% Glycerin Diffbrent from Different from Different from Group NaC1 Means groups (p 0.05) Means groups (p 0.05) Means groups (p 0.05) A 0 31.0 C 23.9 B, C 8.4 B, C B 1.5 21.7 -- 13.2 A, C 5.5 A, C C 3 11.3 A 2.5 A, B 1.6 A, B Nova © DPM Skicon © Corneometer © 5% Glycerin Different from Different from Different from Group NaC1 Means groups (p 0.05) Means groups (p 0.05) Means groups (p 0.05) A 0 99.1 B 61.8 B 17.7 B B 1.5 156.0 A 96.2 A, C 21.4 A, C C 3 116.0 -- 69.9 B 14.9 B 10% Glycerin Nova © DPM Skicon © Corneometer © Different from Different from Different from Group NaC1 Means groups (p 0.05) Means groups (p 0.05) Means groups (p 0.05) A 0 131.2 B, C 97.8 B, C 22.4 B B 1.5 239.0 A 136.4 A, C 29.9 A,C C 3 213.0 A 168.2 A, B 24.6 B
Purchased for the exclusive use of nofirst nolast (unknown)
From: SCC Media Library & Resource Center (library.scconline.org)