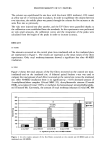
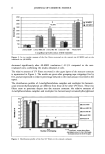
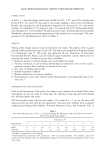
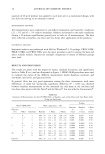
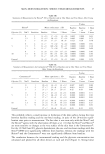
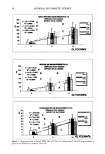
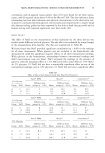
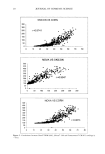
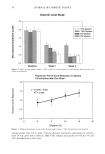
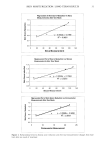
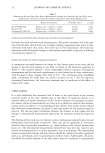
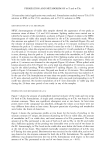
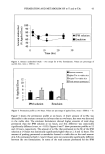
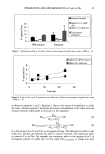
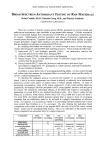
SKIN MOISTURIZATION: SHORT-TERM MEASUREMENTS 17 Table IIb Summary of Measurements by Skicon © 200 at Baseline and at One Hour and Two Hours After Using the Emulsions Skicon © Mean conductance + SD Glycerin (%) NaCI Emulsion Baseline 1 Hour 2 Hours P-value Baseline Baseline l Hour VS VS VS 1 hour 2 hours 2 hours 0 1 13 + 13 37 + 33 34 ñ 26 0.002 0.008 0.63 0 1.5 2 15 _+ 12 28 ñ 15 27 + 14 0.002 0.005 0.75 3 3 14 + 8 17 _+ 9 18 _+ 8 0.323 0.20 0.78 0 4 14 + 7 75 + 42 74 _+ 42 0.0001 0.0001 0.91 5 1.5 5 13 + 9 109 _+ 58 92 -+ 47 0.0001 0.0001 0.18 3 6 13 ñ 7 73 + 38 77 _+ 44 0.0001 0.0001 0.68 0 7 13 + 8 111 ñ 39 117 + 37 0.0001 0.0001 0.50 10 1.5 8 13 ñ 9 181 + 51 167 _+ 63 0.0001 0.0001 0.30 3 9 12 + 7 149 + 65 142 + 60 0.0001 0.0001 0.65 Control 14 _+ 9 25 + 14 24 ñ 11 0.001 0.004 0.70 Table Ilc Summary of Measurements by Corneometer © CM 825 at Baseline and at One Hour and Two Hours After Using the Emulsions P-value Corneometer © Mean capacitance ñ SD Baseline Baseline 1 Hour VS VS VS Glycerin (%) NaCl Emulsion Baseline 1 Hour 2 Hours 1 hour 2 hours 2 hours 0 1 26 _+ 8 34 ñ 11 34 + 12 0.007 0.005 0.88 0 1.5 2 27 + 7 32 + 8 33 + 8 0.019 0.012 0.86 3 3 27 + 7 29 + 7 29 -+ 6 0.42 0.29 0.80 0 4 27 + 7 45 + 11 44 + 11 0.0001 0.0001 0.71 5 1.5 5 27 + 7 48 + 12 47 + 11 0.0001 0.0001 0.56 3 6 27 + 7 42 + 9 43 ñ l0 0.0001 0.0001 0.83 0 7 27 + 6 49 ñ 9 49 + 10 0.0001 0.0001 0.96 10 1.5 8 27 + 6 57 + 8 54 _+ 10 0.0001 0.0001 0.27 3 9 26 + 6 51 ñ 10 50 + 10 0.0001 0.0001 0.82 Control 27 + 7 30 + 8 29 + 8 0.20 0.22 0.95 This probably reflects a small increase in hydration of the skin surface during the time between baseline reading and the one-hour reading, in spite of the 20-minute equili- bration time prior to measurement. The fact that it was seen only with the Nova © and the Skicon © agrees with the observation of Clarys eta/. (11) that the Nova © and Skicon © are more sensitive to changes at the very surface of the skin than is the Corneometer ©. For the 3% NaC1 and 0% glycerin formulation, the one- and two-hour readings with the Nova © DPM were significantly different from baseline, whereas the readings with the Skicon © and the Corneometer © were not significantly different from baseline. The correlation between the instrumental reading and the glycerin concentration was calculated and plotted for all three devices at each salt level (Figure 1). Strong linear

18 JOURNAL OF COSMETIC SCIENCE NOVA DPM.9003 MEASUREMENTS(1H) Diffef9nce from baseline y = 10x + 37.000 ,• EFFECT OF GLYCERIN •=o.ssss B T [. ....o, NACL y = 21.7x +30.500 B . I ........, 0 5 10 GLYCERIN% 3OO 250 2OO 150 100 5O 0 SKICON 200 MEASUREMENTS(1H) y = 7.4x + 24.33' 0.9996 A EFFEC'r OF GLYCERIN y =15.5x +14.833 B B y= 13.4x- 1.000 •::.: o 5 lO , ,0% NACL • 1.5% NACL ..... -.- 13.0• NACL GLYCERIN% 45 35 25 I 15 ,, 0+• CORNEOMETER 825 MEASUREMENT (1H) Difference from baseline y = 1.4x+9.000 EFFECT OF GLYCERIN R 2 = 0.9423 A y = 2.4x+7.000 S R 2 = 0.9796 S y= 2.3x +2.50 •=o.i•4 C. 'r r o 5 , ',0% NACL m 1.5% NACL lO Figure 1. Regression plots of Nova © DPM, Skicon © 200, and Corneometer © CM 825 measurements vs glycerin concentration at different salt levels.
Purchased for the exclusive use of nofirst nolast (unknown)
From: SCC Media Library & Resource Center (library.scconline.org)