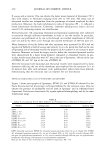
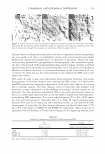
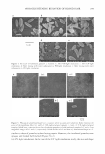
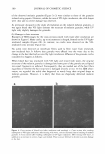
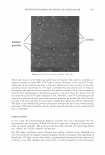
ETHOSOMAL AND LIPOSOMAL DISPERSIONS 255 calorimetry (DSC) (c) the determination of azelaic acid diffusion from ethosomal and liposomal dispersions and (d) the determination of azelaic acid diffusion from ethosomes and liposomes incorporated in a hydrophilic gel. EXPERIMENTAL MATERIALS Azelaic acid (AA) was purchased from Sigma-Aldrich (Milan, Italy). Soy phosphatidyl choline, Phospholipon® 90 (PC) was purchased from Nattermann Phospholipid GmbH (Cologne, Germany). Carbopol® 934 P (Carbomer 934) was from Biochim (Milan, Italy). All other materials and solvents of the high purity grade were from Sigma-Aldrich. PRODUCTION. OF ETHOSOMES For the preparation of ethosomes, PC (50 mg/ml) and AA (2 mg/ml) were first dissolved in ethanol (comprised between 20% and 45%, v/v). An aqueous phase constituted of isotonic Palitzsch buffer (IPB) (5 mM Na2B 4 O 7 , 180 mM H 3 BO 3 , 18 mM NaCl) was then slowly added to the ethanolic solution under continuous stirring at 700 rpm by a Eurostar digital IKA Labotechnik (Sardo Turin, Italy). Mechanical stirring was per formed for 5 min at room temperature. PRODUCTION OF LIPOSOMES Liposomes were prepared by the reverse-phase evaporation method (REV) (11). The aqueous phase consisted of 5 ml of IPB, and the organic phase was a solution of PC (50 mg/ml) and AA (2 mg/ml) in 20 ml of diethyl ether. The biphasic system was vortexed and sonicated at 0°C for 5 min in a bath-type Branson 2200 sonicator (Branson Ultra sonics Co., Danbury, CT). The ether present in the obtained stable emulsion was removed by rotary evaporation under reduced pressure at room temperature, resulting in a turbid, white liposome dispersion. PHYSICAL CHARACTERIZATION OF ETHOSOMES AND LIPOSOMES In order to obtain homogeneously sized vesicles, both ethosomal and liposomal disper sions were extruded with an Extruder™ (Nipex Biomembranes Inc., Vancouver, Canada) through polycarbonate membranes (Nucleopore Corp., Pleasanton, CA) with pores of calibrated diameter (12). In particular, ethosomes and liposomes were subjected to one extrusion cycle through two stacked 400-nm-pore-size filters (LIFO ex 400, ETHO ex 400) followed by three extrusion cycles through two stacked 200-nm-pore-size mem branes (LIFO ex 200, ETHO ex 200). Electron microscopy analyses were performed by the freeze fracturing technique. Briefly, ethosomal or liposomal dispersions were frozen by the "propane jet" technique, cryofixed and microfractured at 108°K (Balzen BAF 300) with a 10- 5 Pa pression, and replicas were reproduced by a platinum/carbone matrix. For the electron microscopy analysis, a

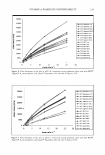
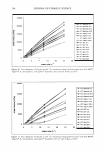
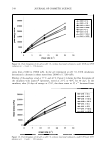
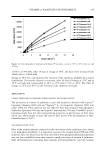
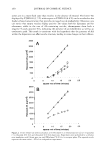
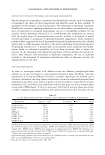
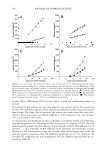
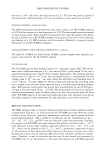
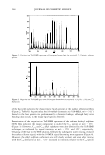
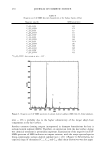
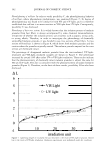
256 JOURNAL OF COSMETIC SCIENCE Philips EM 301 was employed at 1000 KV. Photographs were taken on Agfa Scientia 23D56 film and developed by a Geratone G5C instrument for 3.5 min at 293°K. Photon correlation spectroscopy (PCS). Submicron particle size analysis was performed using a Zetasizer 3000 PCS (Malvern Instruments, Malvern, UK) equipped with a 5 mW helium neon laser with a wavelength output of 633 nm. Glassware was cleaned of dust by washing with detergent and rinsing twice with water for injections. Measurements were made at 25°C at an angle of 90°. Data were interpreted using the "method of cum ulan ts." Differential scanning calorimetry (DSC). The transition temperatures of both ethosomes and liposomes were measured by DSC technique using a Shimadzu TA-60WS in an aluminum pan, under a constant nitrogen stream. Measurements were performed at a temperature range between -40°C and 120°C at a heating rate of 30° per min. The sample weight was about 3 mg, and PC concentration was the same for all samples tested. PRODUCTION OF HYDROPHILIC GELS For the preparation of the hydrophilic gel, the carboxyvinyl polymer carbomer (Carbo pol ® 934 P) (1.5%, w/w) was added to bidistilled water and left to swell at room temperature to obtain a homogeneous and liquified mixture. After an overnight incu bation, triethanolamine was added to neutralize the solution. The obtained gel was alternatively diluted (1.1 % , w/w) with ethanol solution or ethosomal or liposomal suspensions, resulting in a final AA concentration of 1 mg/ml and a carbomer concen tration of 0.75%, w/w. IN VITRO DIFFUSION STUDY The experiments were carried on using a standard glass Franz release rate cell (13) with a 1-cm diameter orifice (0.78 cm2 area) assembled with a cellulose ester-based mem brane, 0.6-µm pore size (Schleicher & Schuell, Germany). As receptor phase a solution of IPB/EtOH 70:30 (v/v) was used. The receptor phase was always degassed before use and poured in the cell body to overflowing, in order to avoid air bubble formation. To study the AA release rate, 1 ml of drug solution or 1 g of the formulation to be analyzed was placed into the donor cell compartment and tamped down on the membrane, previously moistened with the receptor phase. The upper part of the chamber was sealed to avoid evaporation. The receptor phase was stirred by means of a constantly spinning bar magnet and thermostated at 3 7°C. At predetermined time intervals between one and six hours, samples (0.15 ml) of the receptor phase solution were withdrawn and the AA concentration in the receptor phase was measured using HPLC. Each removed sample was replaced with an equal volume of simple receptor phase. The amount of AA released per unit area (µg/cm2 ) was plotted against the square root of time. The slope of the line (regression) represents the release rate of the drug. The release rate coefficients were expressed both as experimentally observed fluxes (Fo) and as normalized fluxes (Fn) or diffusion coefficient (D) (D=Fn=Fo/C, where C is the azelaic acid concentration expressed in mg/ml). All the obtained D values were determined six
Purchased for the exclusive use of nofirst nolast (unknown)
From: SCC Media Library & Resource Center (library.scconline.org)