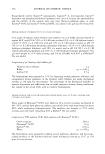
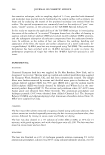
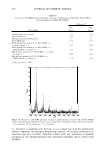
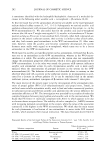
ETHOSOMAL AND UPOSOMAL DISPERSIONS 261 PRODUCTION OF VISCOUS ETHOSOMAL AND LIPOSOMAL FORMULATIONS For the design of a formulation constituted of phospholipid vesicles, such as ethosomes or liposomes, the choice of lipid composition and additives must be done carefully to guarantee vesicle integrity in the final product. The ethosomal or liposomal suspension should have a viscosity-enabling permanence on the skin surface nevertheless the pres ence of surfactants in emulsion formulations can be a considerable problem for the stability of etho-liposomal vesicles (15). It is well known that surfactants can interact with the double layer of liposome/ethosome vesicles, leading to formation of mixed vesicles and finally to disruption of liposome/ethosome organization. These instability problems have suggested the use of liposomal/ethosomal formulations based on colloidal agents, able to confer adequate viscosity to the media stabilizing the physical properties of liposomal systems (16, 1 7). In particular, in the present study, surfactant-free formu lations based on carbomer hydrophilic gel have been produced, able to adjust the viscosity of the ethosomal and liposomal suspensions without altering the vesicle sta bility. After dilution with ethosomal or liposomal suspensions, the use of carbomer resulted in the formation of transparent formulations with an adequate viscosity for administration on the skin. DIFFUSION EXPERIMENTS In order to investigate azelaic acid diffusion from the different phospholipid-based vehicles, an in vitro test based on a percutaneous absorption glass cell (Franz type) was employed (13). Using the diffusion cell with a synthetic membrane, the method can be utilized to determine the drug release characteristics from the ethosome/liposome-based formulations and thus can be used as a quality control procedure to assure batch-to-batch uniformity (18). A cellulose ester membrane with 0.6-µm pore size and a receptor phase constituted ofIPB/ethanol 70:30 (v/v) were used. This kind of receptor phase was chosen in order to guarantee adequate solubility and unrestricted access to AA. Actually, the use Table IV In Vitro Release Rate Coefficients of Azelaic Acid Incorporated in Different Topical Forms Formulationa F 0 µg/cm2 • min°· 5 D cm/min°· 5 103 log D EtOH solution 186.6 15.55 1.19 EtOH/carbomer gel 49.31 4.1 0.61 LIPO 59.63 4.97 0.70 LIPO gel 13.88 1.9 0.28 ETHO 20 87.79 7.31 0.86 ETHO 20 gel 38.62 3.22 0.51 ETHO 40 119.96 9.99 0.10 ETHO 40 gel 54.77 4.56 0.66 EtOH/carbomer gel: ethanol solution incorporated in carbomer-based gel. LIPO: liposome suspension. LIPO gel: LIPO incorporated in carbomer-based gel. ETHO 20: ethosomal suspension produced by the use of ethanol 20%. ETHO 20 gel: ETHO 20 incorporated in carbomer-based gel. ETHO 40: ethosomal sus pension produced by the use of ethanol 40%. ETHO 40 gel: ETHO 40 incorporated in carbomer-based gel. a Azelaic acid concentration was always 12 mg/ml. Experiments were performed by a Franz release rate cell assembled with a cellulose ester membrane (0.6-µm pore size) and !PB/ethanol 70:30 (v/v) as receptor phase. Data are the mean of six determinations. SD: ±8%.

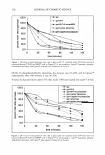
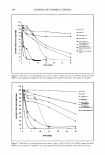
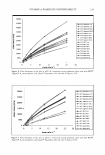
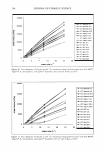
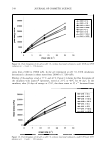
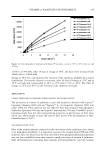
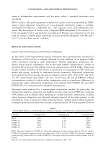
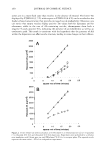
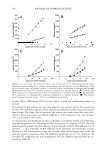
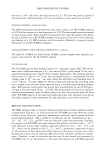
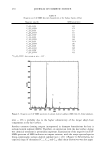
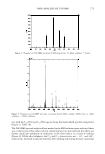
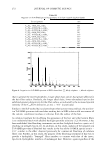
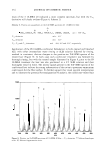
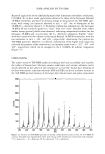
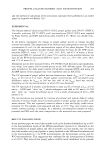
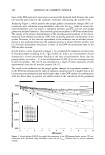
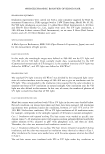
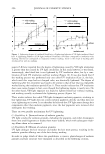
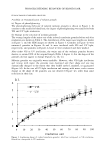
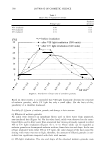
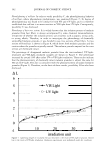
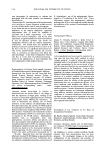
262 JOURNAL OF COSMETIC SCIENCE 3500 A 2000 B 3 000 1600 � 2500 � � 0 0 }2000 }1200 � � .:, 1500 " Cl) Q) 800 1/) 1/) CG CG 1 000 Cl) a: a: 400 500 0 0 0 5 1 0 1 5 2 0 25 0 5 1 0 1 5 2 0 25 square root of time (minutes) square root of time (minutes) 2000 2000 C D 1600 1600 � � 0 0 }1200 }1200 � � " 800 j 800 Cl) 1/) 1/) CG CG Cl) 400 a: 400 0 0 0 5 1 0 1 5 2 0 25 0 5 1 0 1 5 20 25 square root of time (minutes) square root of time (minutes) Figure 3. In vitro release rate kinetics of azelaic acid incorporated in the formulation reported below. Experiments were performed by a cellulose ester membrane with 0.6-µm pore size and !PB/ethanol 70:30 (v/v) as receptor phase. (A) Ethanol solution (6) ethanol solution incorporated in carbomer-based gel (-'.). (B) Liposomal suspension (v) liposomal suspension incorporated in carbomer-based gel (Y). (C) Ethosomal 20% suspension (0) ethosomal 20% suspension incorporated in carbomer-based gel (e). (D) Ethosomal 40% suspension (D) ethosomal 40% suspension incorporated in carbomer-based gel (■). The reported results represent the mean values ± SD of six independent experiments. of pure IPB or !PB/ethanol 80:20 did not lead to a good AA solubilization (data not shown). The amount of AA released per unit area (µg/cm2) was plotted against the square root of time. The cumulative amount of AA released was linear and proportional to the square root of time. The slope, which represents the release rate, steady-state flux, was calcu lated by linear regression. Correlation coefficients of the regression line were between 0.971 and 0.998 in all studies. It is known that the membrane should not impede or control the release rate of the drug from the formulation into the receptor phase, acting only as a support (18,19). This was demonstrated by measuring the diffusion of AA ethanolic solution (D coefficient 15.55 cm/min°· 5 • 103) compared to AA diffusion from liposomal and ethosomal systems (Figure 2). AA concentrations from the solution were always larger than from the vesicular systems, suggesting that the membrane employed was not rate-limiting. The calculated D coefficients for AA incorporated into the different topical forms are re ported in Table IV.
Purchased for the exclusive use of nofirst nolast (unknown)
From: SCC Media Library & Resource Center (library.scconline.org)