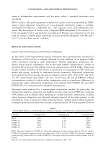
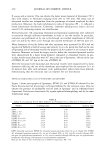
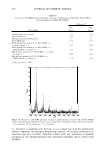
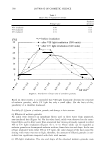
ETHOSOMAL AND LIPOSOMAL DISPERSIONS 257 times in independent experiments, and the mean values ± standard deviations were calculated. HPLC analysis. The quali-quantitative analysis of azelaic acid was performed by HPLC using a J asco apparatus consisting of a two-plungers alternative pump, a variable wavelength UV detector, a Rheodine Inc. 7125 injection valve, and a Shimadzu inte grator. For the analysis of azelaic acid, a Hypersil BDS-ultrasphere Cl8 column (15 x 0.46 cm) packed with 5-µm particles was employed. Elution was conducted at 215 nm with an isocratic mobile phase consisting of acetonitrile:Na phosphate 0.05 M, pH 3 (25:75, v/v) at a flow rate of 1 ml/min. RESULTS AND DISCUSSION PRODUCTION OF ETHOSOMAL AND LIPOSOMAL DISPERSIONS As described in the Experimental section, ethosomes were spontaneously produced by dissolution of PC and AA in ethanol followed by slow addition of an aqueous buffer under continuous stirring at room temperature. During preparation, dispersions dis played initial optical transparency due to the high ethanol concentration's ability to maintain PC in solution. By adding increasing concentrations of IPB buffer, dispersions became turbid. Turbidity of the system is ascribed to a reorganization of PC molecules within the system, resulting in ethosomal vesicles formation. Ethosomal suspensions were produced with increasing amounts of ethanol, namely 20%, 30%, 40%, and 45%, v/v PC concentration was always 5%, p/v. In all cases the use of different ethanol concentrations resulted in white milky suspensions with no significant differences in macroscopic aspect. Ethosomal suspensions with ethanol 20% (ETHO 20) and 40% (ETHO 40), v/v, were selected as standard formulations. Liposomes were produced by a reverse-phase evaporation method. In particular, the method was based on sonication of a biphasic system constituted of IPB and a solution of PC/azelaic acid in diethyl ether, resulting in a stable emulsion. Afterwards, a turbid, white liposome dispersion was obtained through removal of the ether present in the emulsion by rotary evaporation under reduced pressure. Table I reports mean diameters of empty liposomal and ethosomal vesicles, as determined by PCS and expressed both as Table I Vesicle Mean Diameter and Polydispersity of Empty Liposomes and Ethosomes as Determined by PCS Vesicles Z Average (nm) Pol ydispersi ty Intensity (nm) LIPO 790.5 1.00 785.4 ETHO 20 338.4 0.28 328.8 ETHO 30 286.7 0.17 280.0 ETHO 40 259.9 0.22 254.9 ETHO 45 397.8 0.14 394.9 LIPO: liposomal suspension. ETHO 20: ethosomal suspension produced using ethanol 20% by volume. ETHO 30: ethosomal suspension produced using ethanol 30% by volume. ETHO 40: ethosomal suspension produced using ethanol 40% by volume. ETHO 50: ethosomal suspension produced using ethanol 45% by volume. Data are the mean of four determinations on different dispersions. SD: ±5%.

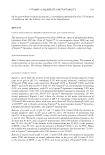
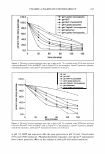
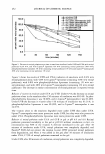
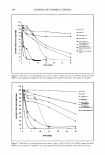
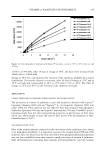
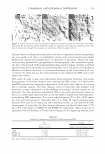
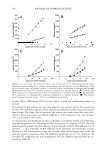
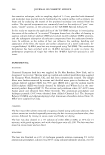
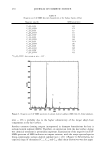
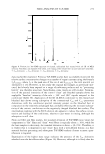
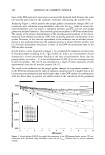
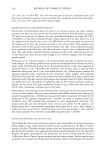
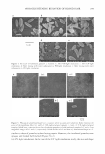
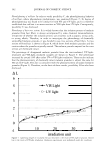
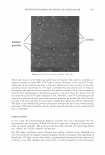
258 JOURNAL OF COSMETIC SCIENCE Z average and as intensity. One can observe the larger mean diameter of liposomes (790.5 nm) with respect to ethosomes (ranging from 260 to 398 nm). The mean size of ethosomal vesicles was independent from the percentage of ethanol employed for their production. Moreover, the high polydispersity index of liposomes (Pl = 1) reflected a broad dimensional distribution. Conversely, ethosome polydispersity indices did not exceed 0.28, indicating narrow size distributions. After production, AA-containing ethosomal and liposomal suspensions were subjected to extrusion through calibrated membranes in order to size the vesicles. In particular, extrusion was performed (a) by one cycle through two stacked membranes of 400-nm pore size and (b) by three cycles through two stacked membranes of 200-nm pore size. Mean diameters of vesicles before and after extrusion were measured by PCS and are reported in Table II as both Z average and intensity. It is to be noted that both in the case of liposomal and of ethosomal vesicles the presence of AA resulted in an increase in mean diameter. Moreover, as found for empty vesicles, before the extrusion liposomal vesicles were characterized by a larger mean diameter compared to ethosomal vesicles. In par ticular, vesicle mean diameters were 817 nm in the case ofliposomes, 440 nm in the case of ETHO 20, and 527 nm in the case of ETHO 40. After the extrusion both liposomal and ethosomal vesicles were characterized by mean diameters reflecting the size of the membrane pore employed for the extrusion. It is to be noticed that, after each extrusion cycle, polydispersity indices have been lowered, demonstrating that the extrusion step can improve the size distribution. PHYSICAL CHARACTERIZATION OF ETHOSOMES AND LIPOSOMES Figure 1 shows micrographs of liposomes, ETHO 20, and ETHO 40 obtained by the freeze-fracture electron microscopic technique followed by the extrusion steps. One can observe the presence of unilamellar vesicles both in liposome- and in ethosome-based dispersions. Vesicles are characterized by regular spheroidal morphology and by the same dimensional range. Table II Azelaic Acid-containing Vesicle Mean Diameter and Polydispersity as a Function of Extrusion Cycle Vesicles Z Average (nm) Polydispersity Intensity (nm) LIPO 817.8 1.00 814.9 LIPO ex 400 233.0 0.31 224.7 LIPO ex 200 165.1 0.14 162.3 ETHO 20 440.8 0.28 428.8 ETHO 20 ex 400 305.9 0.14 260.0 ETHO 20 ex 200 179.5 0.09 177.2 ETHO 40 527.5 0.22 531.0 ETHO 40 ex 400 274.9 0.16 244.9 ETHO 40 ex 200 173.9 0.02 174.9 LIPO: liposomal suspension. ETHO 20: ethosomal suspension produced by the use of ethanol 20%. ETHO 40: ethosomal suspension produced by the use of ethanol 40%. ex 400: vesicles extruded through 400- nm-pore-size polycarbonate membranes. ex 200: vesicles extruded through 400-nm-pore-size polycarbonate membranes and through 200-nm-pore-size polycarbonate membranes. Data are the mean of four determinations on different dispersions. SD: ±5%.
Purchased for the exclusive use of nofirst nolast (unknown)
From: SCC Media Library & Resource Center (library.scconline.org)