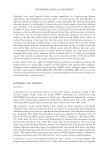
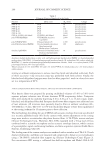
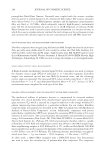
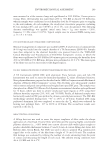
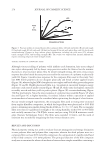
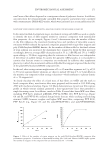
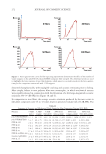
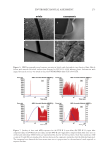
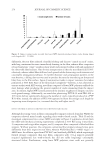
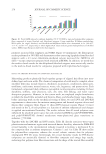
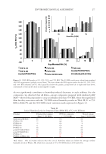
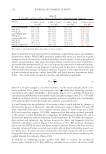
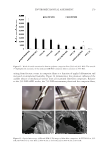
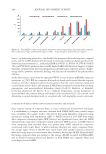
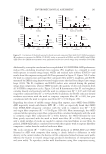
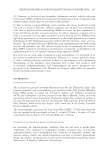
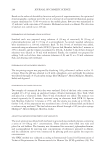
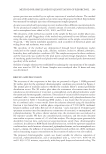
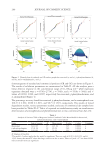
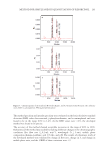
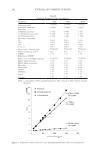
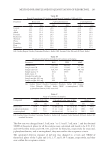
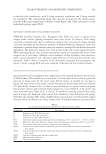
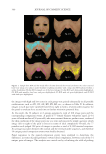
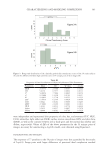
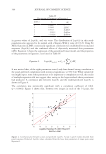
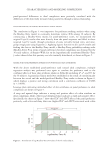
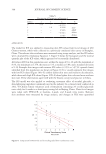
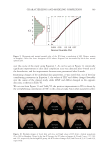
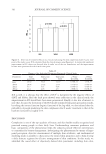
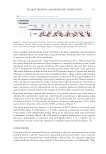
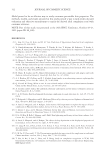
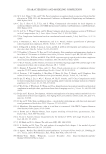
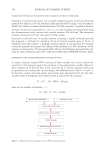
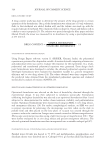
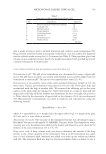
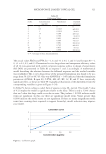
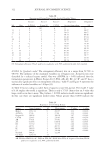
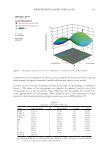
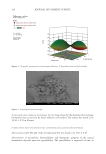
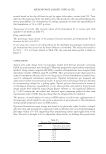
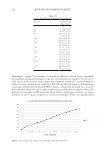
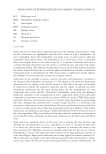
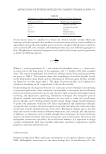
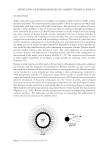
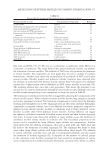
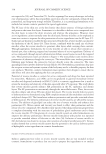
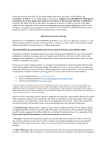
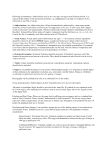
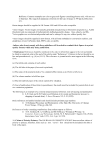
290 JOURNAL OF COSMETIC SCIENCE chromatograms of standard and commercial products (GR and GG) are shown in Figure 3. The results of validation parameters are summarized in Table II. All the analytes gave a linear detector response in the concentration range of 10–150 µg mL−1 while regression equations obtained were y =8736x−27796, y =7045x, and y =555.9x +584.9, and r2 values of 0.9993, 0.999, and 0.9997, respectively for resorcinol, p-phenylenediamine, and m-aminophenol (Figure 4). The percentage recovery found for resorcinol, p-phenylenediamine, and m-aminophenol were 100.27 ± 2.19%, 99.60 ± 1.82%, and 99.73 ± 1.51%, respectively. The results of forced degradation studies, various parameters studied, and assays of commercial dye samples have been provided in Tables III–V. Yeh et al. reported an interlaboratory study on simultaneous determination of aminophenols and phenylenediamines in two commercial hair dyes (31). Figure 2. Normal plots of residuals and 3D surface graphs for resorcinol (a1 and a2), p-phenylenediamine (b1 and b2), and m-aminophenol (c1 and c2). Table I Analysis of Variance Table of Response Surface Combined Cubic Mean Model for Resorcinol, p-phenylenediamine, and m-aminophenol Items Sum of squares df Mean square F value p value Commenta Resorcinol 3,110.05 27 115.19 5.97 0.0001 a p-phenylenediamine 2,541.96 39 65.08 5.83 0.0026 b m-aminophenol 2,004.64 27 74.25 2.52 0.0152 c df: Degrees of freedom. a The model’s F values imply that the model is significant. There are only (a) 0.01%, (b) 0.02%, and (c) 1.52% chance that model F values this large could occur due to noise. Values of “prob F” less than 0.0500 indicate model terms are significant.

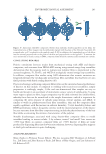
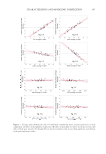
291 METHOD FOR SIMULTANEOUS QUANTITATION OF RESORCINOL The method precision and interday precision were evaluated on the basis of relative standard deviation (RSD) values for resorcinol, p-phenylenediamine, and m-aminophenol and were found to be in the range 0.6% to 1.4%. As the RSD values were 2%, the developed method was found to be precise. The accuracy of the method showed acceptable recoveries in the range of 99% to 101%. Robustness of the method was studied by making deliberate changes in the chromatographic conditions like flow rate (±0.2 mL min−1), wavelength (λ ± 5 nm), mobile phase composition (hexane-1-sulfonic acid ±5 mL), and pH. The results of robustness study of the developed method were validated by change in flow rate, change in λ, and change in mobile phase ratio, and the %RSD of those variations were 2. Figure 3. Chromatograms of (A) standard, (B) Godrej Expert, and (C) Garnier Color Naturals. AU: arbitrary units MAP, m-aminophenol PPD, p-phenylenediamine.
Purchased for the exclusive use of nofirst nolast (unknown)
From: SCC Media Library & Resource Center (library.scconline.org)