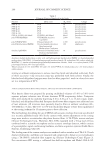
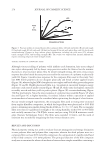
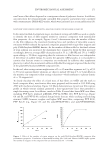
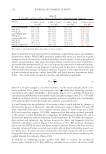
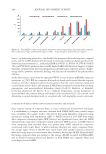
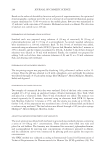
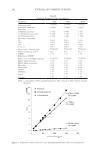
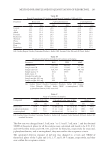
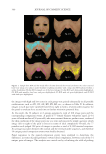
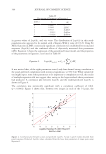
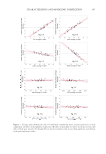
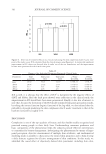
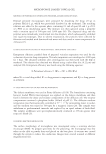
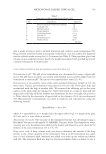
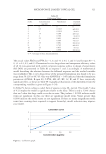
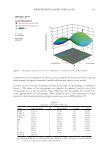
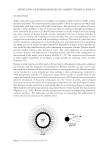
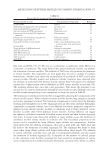
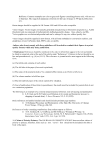
292 JOURNAL OF COSMETIC SCIENCE Table II Validation Parameters of Proposed Method Parameters RES PPD MAP Linearity, µg mL−1 10–150 10–150 10–150 Correlation coefficient 0.9993 0.9990 0.9997 Precision (i) Method precision 0.760 0.898 1.657 (ii) Intermediate precision 1.820 1.238 1.636 (iii) System precision 0.360 1.490 1.349 Accuracy, %recovery 50 100.4 99.6 100.1 100 100.5 100.4 99.9 150 100.4 100.6 100.8 Assay, %101.2 100.1 100.3 Purity angle threshold angle Peak pure Peak pure Peak pure Solution stability up to 24 h Yes Yes Yes %RSD 1.33 1.23 1.19 Robustness, %RSD RSD 2% in modified condition Complies Complies Complies Mobile phase ratio plus 0.18 0.13 0.10 Mobile phase ratio minus 0.21 0.07 0.14 Flow plus 0.38 0.51 0.25 Flow minus 0.76 0.52 0.09 pH plus 1.55 1.52 0.53 pH minus 1.33 1.97 1.23 λ plus 1.21 1.46 1.27 λ minus 1.61 1.37 1.48 MAP: m-aminophenol PPD: p-phenylenediamine RES: resorcinol RSD: relative standard deviation. Figure 4. Calibration curves of (A) resorcinol, (B) p-phenylenediamine, and (C) m-aminophenol.

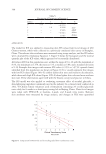
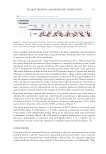
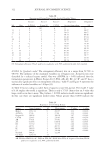
293 METHOD FOR SIMULTANEOUS QUANTITATION OF RESORCINOL The flow rate was changed from 1.5 mL min−1 to 1.3 and 1.7 mL min−1, and the obtained %RSD of theoretical plates for all the analytes were calculated and found to be 0.76, 0.52, and 0.09 for flow minus and 0.38, 0.51, and 0.25 for flow plus, respectively for resorcinol, p-phenylenediamine, and m-aminophenol they were within the acceptance criteria. The optimized detector response of 225 nm was changed to ±5 nm and %RSD of theoretical plates of the λ plus and 1.61, 1.37, and 1.48 λ minus, respectively, and they were within the acceptance criteria. Table III Forced Degradation (%)Studies on Commercial Samples of GR and GG Parameter Resorcinol p-phenylenediamine m-aminophenol GR GG GR GG GR GG Control 0.1 –0.2 –0.6 –0.5 –0.9 –0.8 Acid 20.3 21.6 23.6 28.5 24.3 23.2 Alkali 21.1 22.1 25.9 22.5 20.9 19.9 Peroxide 20.2 20.0 29.5 25.9 22.0 23.4 Reduction 20.0 28.4 24.3 24.5 27.4 23.3 Thermal 23.5 25.1 22.0 20.6 23.2 21.5 Photo 27.6 26.5 29.3 24.4 19.9 24.3 Humidity 21.1 23.0 20.8 23.0 23.4 20.9 Heat 20.1 20.5 20.3 21.4 23.3 22.0 Hydrolysis 20.4 27.6 22.6 23.2 21.5 27.4 GG: Godrej Expert (Godrej Consumer Products, India) GR: Garnier Color Naturals (L’Oreal, India). Table V Assay of Commercial Samples Compound Label claim, mg Calculated value, (mg ± SD) Assay, %GR GG GR GG GR GG Resorcinol 50.0 57.0 50.89 ± 0.58 57.3 ± 0.36 101.2 100.2 p-phenylenediamine 72.0 81.0 71.24 ± 0.61 80.9 ± 0.55 100.1 99.8 m-aminophenol 68.2 71.0 68.24 ± 0.43 71.2 ± 0.51 100.3 100.5 GG: Godrej Expert (Godrej Consumer Products, India) GR: Garnier Color Naturals (L’Oreal, India) SD: standard deviation. Table IV Parameters Studied for Standard and Commercial Samples Parameter RES PPD MAP Standard area 740,355 981,352 62,587 Sample area GR 1,123,920 133,443 117,108 Sample area GG 518,353 870,906 88,744 Sample purity, %101.1 100.6 100.1 Label claim, %25 1 2 Standard weight, mg 50 70 7 Sample weight GR, mg 453 453 453 Sample weight GG, mg 368 368 368 GG: Godrej Expert (Godrej Consumer Products, India) GR: Garnier Color Naturals (L’Oreal, India) MAP: m-aminophenol PPD: p-phenylenediamine RES: resorcinol.
Purchased for the exclusive use of nofirst nolast (unknown)
From: SCC Media Library & Resource Center (library.scconline.org)