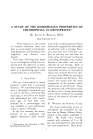
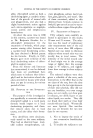
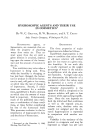
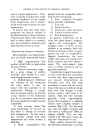
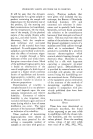
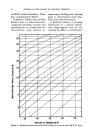
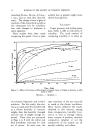
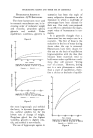
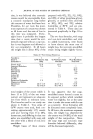
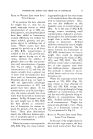
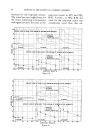
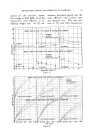
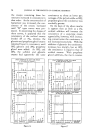
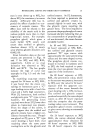
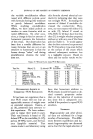
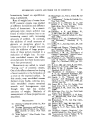
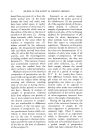
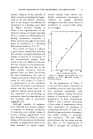
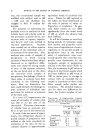
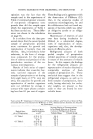
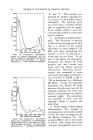
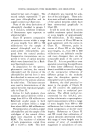
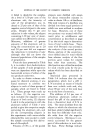
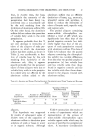
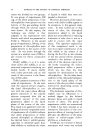
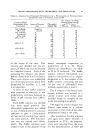
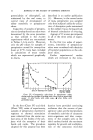
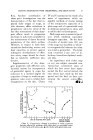
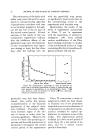
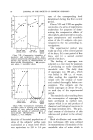
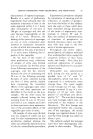
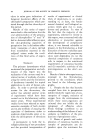
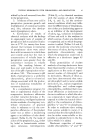
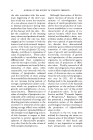
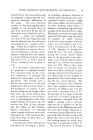
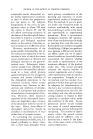
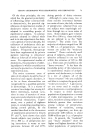
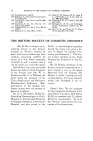
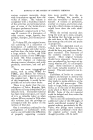
40 JOURNAL OF THE SOCIETY OF COSMETIC CHEMISTS 0-8001 I I I I I o.,oot3 • 0'600 [/- i A - •i ø'5øøV i / i0'400[-- i • ! \ 4oo 45o 500 55o 8oo 85o w•w L[,0T.S m M•LUM•C•0,S Chart II.•Comp•ative transmission curves for natural chlorophyll and for sodium magnesium chlorophyllins prepared from the natural chlorophyll. • natural chlorophyll, - - - water-sol• hie chlorophyllins. 0.800 0.700 0,600 0.500 0.400 0.300 0.200 •100 o 4o0 Chart 450 500 550 600 650 700 WAVE LENGTHS IN MILLIMICRONS Ill.--Comparative transmission curves for a preparation of sodium-copper chlorophyllins and an acid-digest of chloro- phyll in alkaline solutions. • water-soluble chlorophyllins, - - - acid-digest of chlorophyll. "a" and "g." This product was prepared by alkaline saponification of a portion of the purified natural chlorophyll. The resulting prod- uct, in dry form, contained 1.68 per cent of magnesium but no copper. It was readily soluble in water but only sparingly soluble in either ethyl ether or acetone. 3. dcid-Digest of Natural Chloro- phyll. This derivative or mixture of derivatives was prepared by add- ing to a portion of the natural chlorophyll an equal weight of 2 M HC1 and, then, maintaining this mixture at 37øC. by heating in a water bath for two hours. At the end of this period the black-green precipitate was filtered off under pressure and then washed with water until the flitrate returned chlorine-free. Thereafter, the pre- cipitate was suspended in water- and stirred thoroughly during titra- tion with 0.01 N NaOH to pH = 7.00 as determined by a Beckman pH Meter. 'Finally, the suspended precipitate was filtered off under pressure, chlorides were removed by repeated washings with water and, finally, the precipitate was dried to constant weight. The preparation was insoluble in water and only sparingly soluble in acetone and ethyl ether. •. I4Zater-Soluble Sodium-Copper Chlorophyllins. Two samples of this preparation were made available for this and other investigations by the Rystan Company, Inc. The samples differed only in their states of purity. One sample was 93 per cent pure chlorophyllins and it con-

TESTING DEODORANTS WITH CHLOROPHYLL AND DERIVATIVES 41 tained 6.2 per cent of copper. The second sample represented 77 per cent pure chlorophyllins and its copper content was 5.0 per cent. None of the three derivatives of chlorophyll, classified in groups 2 to 4 inclusive, exhibited evidences of fluorescence upon exposure to ultraviolet light. Chart II presents comparative transmission curves within a range of wave lengths from 400 to 700 millimicrons for the sample of natural chlorophyll and for the water-soluble chlorophyllins pre- pared from the natural product. Comparative transmissions are re- ported in terms of optical densities which were determined by a Beck- man Spectrophotometer. In preparation for the spectro- photometric analyses, the natural chlorophyll and the mixture of the chlorophyllins derived from it were first dissolved in acetone and, then, extracted from the acetone solutions by ethyl ether. The latter extracts were used in determinations of the optical densities reproduced graphi- cally in Chart II. Curves for both products show maximum optical densities within a range from 410 to 430 millimicrons. Relatively smaller peaks in both curves are evident within a range from about 640 to 660 millimicrons. The preparation of sodium-copper chlorophyllins and the sample of the acid-digest of the natural chloro- phyll were dissolved in 0.01 N KOH. The reactions of solutions of both preparations varied from pH = 11.50 to 12.00. This level of alkalinity was required for solu- tion of the acid-digest. These solu- tions were utilized in determinations of the optical densities which have been summarized graphically in Chart III. It will be noted that both curves exhibit maximum optical densities at wave lengths of approximately 420 millimicrons. In this respect, the two curves of Chart III are in good agreement with the curves in Chart II. However, peaks in curves of Chart III at the higher wave lengths, i.e., from 640 to 660 millimicrons are definitely smaller and more divergent than are the comparable peaks of the curves of Chart II. It is not possible to even speculate concerning the significance of these latter differences because there is available no exact knowledge of the comparative influences of different groups in the molecule upon the absorption spectra of chlorophyll and its derivatives. However, the chief practical in- terest in the graphs of Charts II and III concerns the application of these data to analytical pro- cedures. The official method rec- ommended by the A.O.A.C. pre- scribes colorimetric or spectrophoto- metric measurements within a range of wave lengths from 600 to 660 millimicrons but it does not exclude check comparisons at shorter wave lengths. References to Charts II and III reveal that utilizations of optical densities determined within this range of wave lengths may be sources of error of considerable magnitude in calculations of com-
Purchased for the exclusive use of nofirst nolast (unknown)
From: SCC Media Library & Resource Center (library.scconline.org)