!}77½':4 STATISTICAL METHODS IN THE COSMETIC INDUSTRY i' •:5•'Undergo some reaction with the prickle cells of the basal layer, which results }?in the liberation of histamine, this giving rise to the dermatitis. (Local }i :[:' application of an antihistamine will frequently give rapid relief from the {?•iMtation.) Typical irritants are flower pollen, orris root, linalool, methyl •:[•.:•:[ :heptine carbonate, terpineol, hydroxycitronellal, rosin, penicillin, sulphona- • '?'mides, paraphenylenediamine, chromium salts, chlorxylenols, bromoeosine, bergamot oil, etc., the last two being photosensitisers activated by U.V. [:•{[:light to give reactions, and the penultimate two primary irritants at high i.:•: ' concentrations. Everybody is probably sensitive to some substance or other, and it is •(•:•:-sometimes found that a person suddenly becomes sensitised to a substance which has harmlessly been in frequent contact ruth the same area of the .:•:. sk• for years. ::/•:' The prophetic patch test is concerned with secondary irritants, primary irritants being easily eliminated from consideration after a dozen or so tests. The only way to discover whether a product used at a very low concentration :::is likely to be a secondary irritant to more than a very few people is to use one of the techniques discussed above on a random sdection of possible users of the product. However, a way can be found by which the number of the •sensitised reactions obtained from a substance can be increased and the effect of a new substance assessed relatively to that of a substance whose use is well established. Schwarz, • when testing a deodorant soap, carried out patch tests at various concentrations to determine the concentration at which a solution of a well-kno• (presumably widely sold and accepted as safe) toilet soap would not cause a reaction on most of his ten test subjects. tt. F. Smyth, et al,* found that such substances as glycerin, lanolin, petroleum jelly and cocoa butter, can give rise to sensitisation reactions and are secondary i•itants to an extent of gi•ng between 1 to 3 positive sensitisation reactions among 100 test subjects. The materials also gave reactions on the first application to the skin and, since they are not primary irritants, it must be concluded that those persons so reacting had pre•ously been sensitised, thus bringing the number of reactions out of 100 persons to 4 (glycerol, cocoa butter, petroleum jelly) and to B 0artolin). It is common knowledge that dilute solutions of these substances do not give rise to anything like this per- centage of secondary reactions, and therefore it must be concluded that con- centration of substance has some bearing on the matter. If the prickle cells of any person's skin include a cert ain proportion w•ch Mll react •th a given sub- stance to liberate histamine, and if the distribution of those persons with each proportion of such cells follows the normal Gaussian curve, there •11 be a few people who Mll be sensitised by a weak concentration, more people who •11 be sensitised by a higher concentration and so on. Increasing the concentration and/or the period of contact should increase the number of sensitised reactors. 233

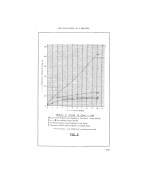
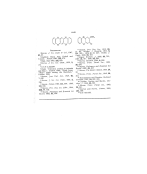
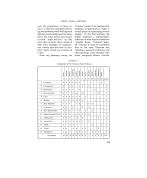
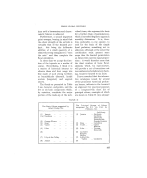
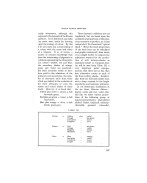
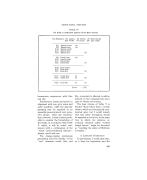
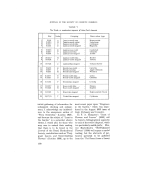
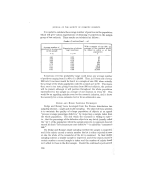
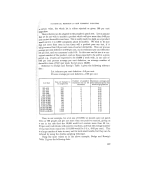
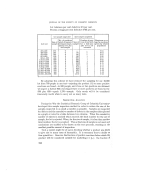
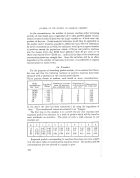
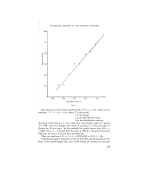
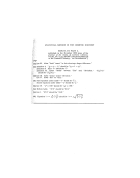
JOURNAL OF THE SOCIETY OF COSMETIC CHEMISTS In the circumstances, the number of persons reacting under increasing severity of test would give a sigmoidal curve when plotted against concen- tration or time if either of them was the single variable or--if both vary--the product of the two. Probit analysis technique would then be applicable to the •esults, and it would be possible to define the toxic effect o• substances by (i) the concentration at which the substance would give an agreed number of positives among the population, called--if 50 per cent positive reactions was the chosen level--the ED50 level (effective dose 50 per cent) or--if 10 per cent was the level--EDI0, etc.: and by (ii) the slope of the transformed concentration/reactions straight line. Since the irritation will be an effect dependent on the number of molecules of irritant, it is preferable to express. concentrations in molar terms. AN •XAMPLE For the purposes of describing probit analysis, let us assume that tkis is the case and that the following numbers of positive reactions have been obtained with a substance at the concentrations shown ' Thirty persons chosen at random, each tested at seven concentrations' ,. Molar Log•oM/x Number of q-vereac- Proportion of Empirical pro- tions 1st reactions q-re reactions bit of per cent concentration "dosage" plus sensitised ones. M/x "dose" per cent M/300 -- 2.52 1 3 3-12 M/100 -- 2.00 1 3 3-12 M/30 -- 1.52 5 17 4.05 M/10 -- 1.00 15 50 5.00 M/3 - 0.52 15 50 5-00 M 0-00 24 80 5-84 3M 0.47 26 87 6-13 In the above the dose has been transformed by using the logarithms of "dose." The transformed values are referred to as "dosages." The first step in the analysis is to convert the per cent reactions into empirical probits by reference to a table of probits which will be found in most textbooks on statistics. The parts of such a table relevant to our example are: O/o 0 1 2 3 4 5 6 7 8 9 0 -- 2.67 2-95 3.12 3.25 3.36 3.45 3.52 3.59 3.66 10 3-72 3.77 3.82 3.87 3-92 3-96 4.01 4.05 4,08 4.12 50 5.00 5.03 5.05 80 5.84 5.88 5.92 5.95 5-99 6.04 6.08 6-13 6.18 6.23 Empirical probits corresponding to reactions have been put into colurea 5 of the above table of concentration-reactions found. The probits and log concentrations are now plotted in a graph to give ß 234
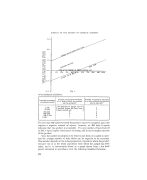
Purchased for the exclusive use of nofirst nolast (unknown)
From: SCC Media Library & Resource Center (library.scconline.org)