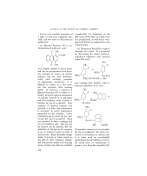
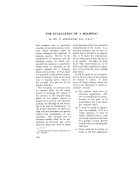
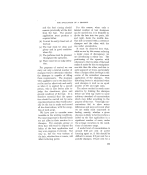
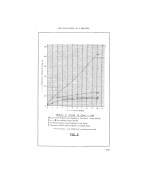
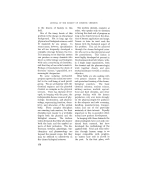
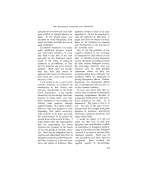
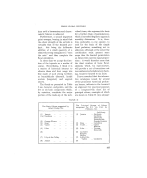
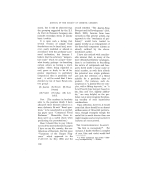
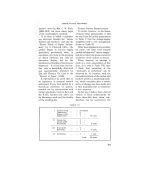
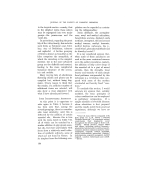
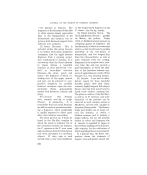
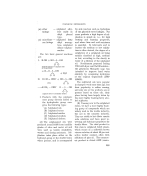
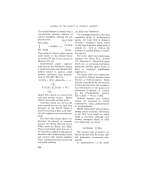
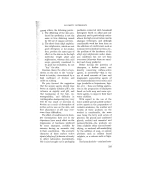
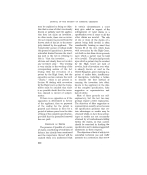
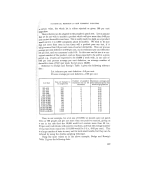
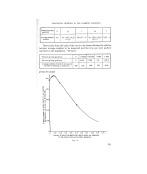
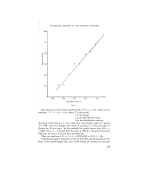
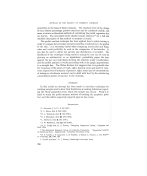
STATISTICAL MEalHODS IN THE COSMETIC INDUSTRY 70- 5.01 3'0- -3-0 -2'0 -1 '0 0'0 1' Log Molar Conc'n. F,g. 3. The equation to the' probit regression line is Y = a q- bx, which can be rewritten ß Y = 5 + (x -- l•)/o, where Y is the probit x is the dosage /• is the distribution centre ,• is the distribution variance. The slope of the line is 1/, ß the value of •, that dosage value of x giving Y== 5.00 ' the EDco dosage, that value of x giving Y = 3.72 (see table of Probits for 10 per cent). In the example the graph shows that ED5o = -0'675, EDco '-- --1-75 and that the slope is 0.85 (i.e. the probit increases 0.35 units for each 1.0 unit of log concentration). Thus our equation is Y ---- 5 q- (x q- 0-675)/0-85 ---- 5.79 q- 1-18x. Substances would be expected to vary in their ED,o levels and also in the slope of the probit/dosage line, and could readily be screened for irritant 235

JOURNAL OF THE SOCIETY OF COSMETIC CHEMISTS properties on the basis of these constants. The standard error of the dosage at any desired percentage positive reactions can be calculated readily, and more accurate arithmetical methods of calculating the probit regression line are known. The interested reader should consult reference •ø for a full and readable description of this method of analysis of results. The probit analysis technique has been applied here to patch testing in order to compare the secondary irritant properties of substances to be applied to the skin it is extremely useful when comparing insecticides and fungi- cides and could profitably be used in the comparison of bactericides. It can also be used to define the particle size distribution of powders. The likelihood of the technique's being useful in any given case can be seen by plotting on arithmetical, or on logarithmic, probability paper the dose against the per cent individuals showing the attribute under consideration, and the probit analysis is worth proceeding with if the graph approximates to a straight line. The Weber-Fechner law suggests that it is probable that the responses of the senses of touch, sight, hearing, taste and smell to varia- tions respectively of intensity of pressure, light, sound and of concentrations of tasting or odoriferous material can be dealt with best by the relation log concentration-probit of reaction to the stimulus. SUMMARY In this article an attempt has been made to introduce techniques for studying samples and to show their limitations in making deductions regard- ing the whole population from which the sample was drawn. Work is in hand to study the probit analysis method of tackling the prophetic patch test, and this will be separately reported upon in due course. I-•EFERENCES • L. Schwartz, J.S.C.C., I, 46 (1947). • J. L. Morse, ibid, I, 246 (1949). * H. A. Shelanski, ibid. II, 324 (1951). * E. J. Moynahan, ibid. III, 203 (1952). • L. Schwartz, ibid, II, 321 (1951). • A. W. Middleton, ibid, III, 253 (1952). ? H. F. Dodge and H. G. t•omig, "Sampling Inspection Tables," Chapman and Hall, 1944. • The Statistical Research Group of Columbia University. "Sequential Analysis of Statistical Data. Applications," Columbia University Yress. * H. F. Smyth, C. P. Carpenter, C. B. Schaffer, J. Seaton, L. Fischer, J. I•d. Hygie,•e • Toxicology, 24, 1942, 281. •0 "Probit Analysis," D. ]. Finney, Cambridge University Fress. 236
Purchased for the exclusive use of nofirst nolast (unknown)
From: SCC Media Library & Resource Center (library.scconline.org)