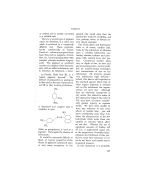
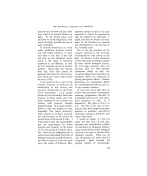
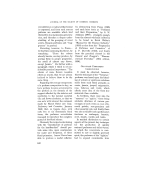
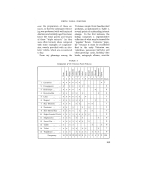
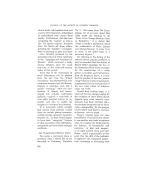
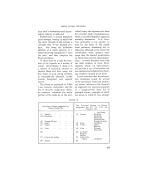
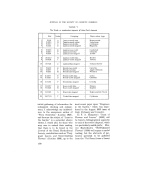
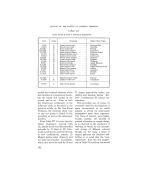
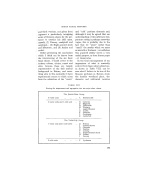
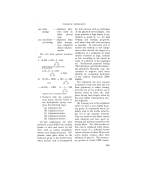
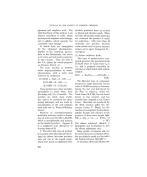
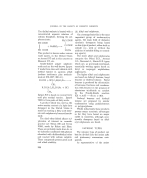
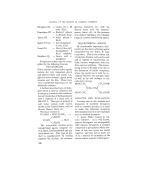
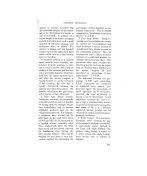
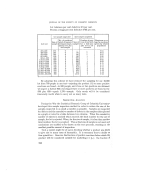
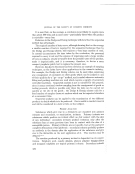
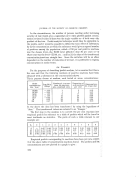
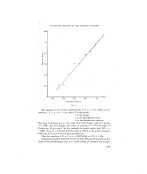
JOURNAL OF THE SOCIETY OF COSMETIC CHEMISTS In the circumstances, the number of persons reacting under increasing severity of test would give a sigmoidal curve when plotted against concen- tration or time if either of them was the single variable or--if both vary--the product of the two. Probit analysis technique would then be applicable to the •esults, and it would be possible to define the toxic effect o• substances by (i) the concentration at which the substance would give an agreed number of positives among the population, called--if 50 per cent positive reactions was the chosen level--the ED50 level (effective dose 50 per cent) or--if 10 per cent was the level--EDI0, etc.: and by (ii) the slope of the transformed concentration/reactions straight line. Since the irritation will be an effect dependent on the number of molecules of irritant, it is preferable to express. concentrations in molar terms. AN •XAMPLE For the purposes of describing probit analysis, let us assume that tkis is the case and that the following numbers of positive reactions have been obtained with a substance at the concentrations shown ' Thirty persons chosen at random, each tested at seven concentrations' ,. Molar Log•oM/x Number of q-vereac- Proportion of Empirical pro- tions 1st reactions q-re reactions bit of per cent concentration "dosage" plus sensitised ones. M/x "dose" per cent M/300 -- 2.52 1 3 3-12 M/100 -- 2.00 1 3 3-12 M/30 -- 1.52 5 17 4.05 M/10 -- 1.00 15 50 5.00 M/3 - 0.52 15 50 5-00 M 0-00 24 80 5-84 3M 0.47 26 87 6-13 In the above the dose has been transformed by using the logarithms of "dose." The transformed values are referred to as "dosages." The first step in the analysis is to convert the per cent reactions into empirical probits by reference to a table of probits which will be found in most textbooks on statistics. The parts of such a table relevant to our example are: O/o 0 1 2 3 4 5 6 7 8 9 0 -- 2.67 2-95 3.12 3.25 3.36 3.45 3.52 3.59 3.66 10 3-72 3.77 3.82 3.87 3-92 3-96 4.01 4.05 4,08 4.12 50 5.00 5.03 5.05 80 5.84 5.88 5.92 5.95 5-99 6.04 6.08 6-13 6.18 6.23 Empirical probits corresponding to reactions have been put into colurea 5 of the above table of concentration-reactions found. The probits and log concentrations are now plotted in a graph to give ß 234

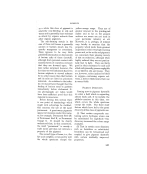
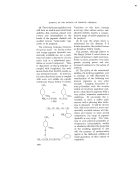
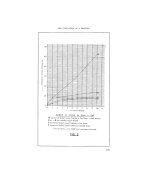
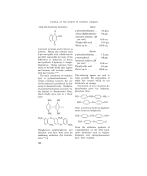
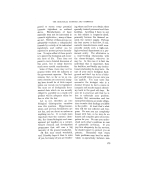
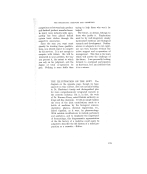
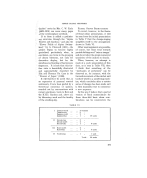
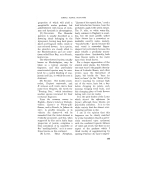
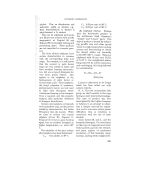
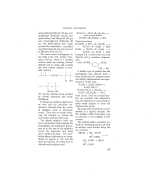
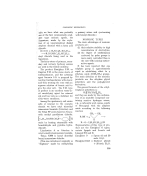
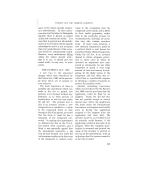
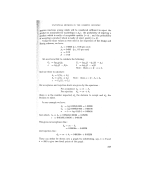
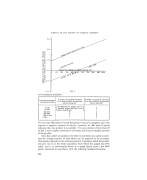
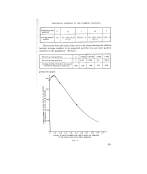
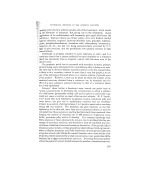
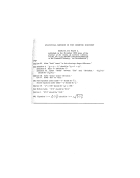
STATISTICAL MEalHODS IN THE COSMETIC INDUSTRY 70- 5.01 3'0- -3-0 -2'0 -1 '0 0'0 1' Log Molar Conc'n. F,g. 3. The equation to the' probit regression line is Y = a q- bx, which can be rewritten ß Y = 5 + (x -- l•)/o, where Y is the probit x is the dosage /• is the distribution centre ,• is the distribution variance. The slope of the line is 1/, ß the value of •, that dosage value of x giving Y== 5.00 ' the EDco dosage, that value of x giving Y = 3.72 (see table of Probits for 10 per cent). In the example the graph shows that ED5o = -0'675, EDco '-- --1-75 and that the slope is 0.85 (i.e. the probit increases 0.35 units for each 1.0 unit of log concentration). Thus our equation is Y ---- 5 q- (x q- 0-675)/0-85 ---- 5.79 q- 1-18x. Substances would be expected to vary in their ED,o levels and also in the slope of the probit/dosage line, and could readily be screened for irritant 235
Purchased for the exclusive use of nofirst nolast (unknown)
From: SCC Media Library & Resource Center (library.scconline.org)