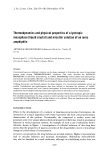
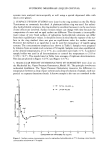
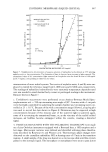
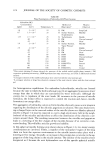
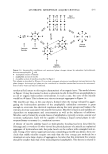
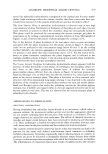
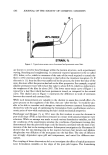
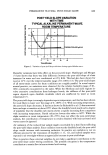
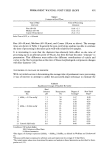
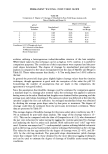
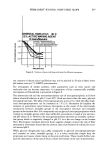
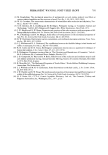
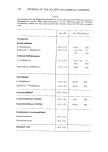
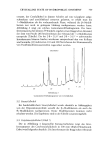
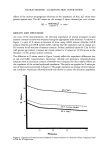
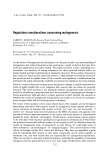
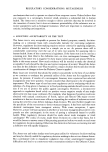
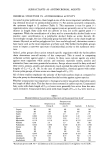
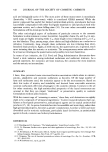
664 JOURNAL OF THE SOCIETY OF COSMETIC CHEMISTS 75 70 6• 60 ,50 45 CMC l, , i 2 o --,.- INITIAL VALUES, t o © • LATER VALUES 37 ø C 40 I I I I I I 0 3 4 5 6 7 8 9 I0 CONCENTRATION NAFOXIDINE HCl (mg/ml) Figure 4. Surface tension-concentration curve for nafoxidine hydrochloride at 37øC showing critical micelle concentration minimum at 0.83 mg/ml. same solvent. Thus in these studies the solvent was water and the standard was sucrose. The difference in temperature between solvent and solution after vapor equilibrium is a colligative effect. This temperature difference is detected on a thermistor bridge cir- cuit by measuring electrical resistance. The measured resistances for a series of aqueous solutions of nafoxidine HC1 at different concentrations at 37øC are shown in Table II and plotted in Figure 5. Since nafoxidine HCI is an electrolyte and dissociates in water to form chloride ion and drug cation, at infinite dilution it will have a theoretical apparent molecular weight Table II Vapor Pressure Measurements by Thermoelectric Osmometry Apparent a Mol Conc. Nafoxidine HC1 Resistance Conc. Sucrose Weight of mg/ml Molarity Ohms Molarity Nafoxidine HC1 0.01 2.16 x 10 -s 0 0 0 0.088 1.91 X 10 -4 0.10 1.5 X 10 -a 59 0.460 9.94 X 10 -4 0.10 1.5 X 10 -a 307 1.012 2.19 X 10 -a 0.30 4.3 X 10 -a 235 2.012 4.54 X 10 -a 0.50 7.3 X 10 -a 276 4.959 1.07 X 10 -2 0.55 8 X 10 -a 621 9.984 2.16 X 10 -2 0.45 6.5 X 10 -a 1536 0.70 1.0 X 10 -2 1.40 2.0 X 10 -= Actual molecular weight of nafoxidine HC1 is 462.

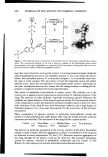
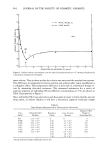
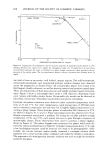
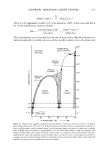
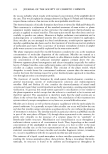
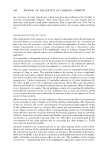
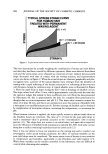
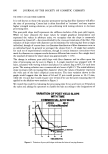
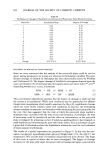
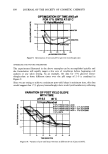
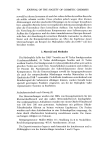
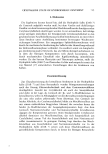
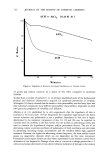
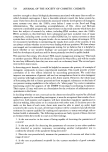
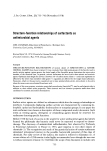
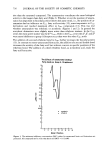
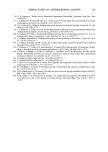
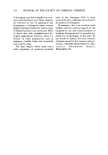
LYOTROPIC MESOPHASE (LIQUID CRYSTAL) 665 1.6 1.4 1.2 0.4 0.2 •7 ø C CMC / / / / / / / / / / / / / ! /// "•DEAL ELECTROLYTE // 2xM SUCROSE / •llßl I K• I I I I I I I I 2 4 8 8 IO 15 xlO -3 MOLES LITER-I NAFOXIDINE HCl o I I 0 20 25 Figure 5. Molecular weight determination by thermoelectric osmometry of nafoxidine hydrochloride and sucrose standard at 37øC, showing a cmc value at 4 x l0 -a mol 1 -• for the apparent levelling effect. Adjust- ing for ionic dissociation, the cmc range is then near 2 x 10 -• tool or 0.92 mg/ml. equal to one-half of the true molecular weight. Thus the apparent molecular weight value as a function of concentration will vary, depending on the activity coefficient. If other effects, such as dissociation of cation to free amine, decomposition, or associa- tion such as micellization are involved, further variation and departure from ideality will occur. Sucrose is relatively well behaved and gives a response which is typical for singularly dispersed, monomolecular species. Completely ionized substances, which are not aggregated or associated, should also give a linear response of resistance with changing concentration. However, in many cases of ionizing substances in aqueous so- lutions, departure from ideality is common. 4. LIGHT SCATTERING MEASUREMENTS were all performed at 25øC because of the difficulty in adapting the commercial instruments to temperature control at other ranges. It is recognized that turbidimetric measurement of a solution at only one temperature is not sufficient to determine a solubilization end point (because turbidity can arise from either miceliar solubilization limits or cloud point depression). Nephe- lometric measurements, however, were more carefully controlled at 25øC, providing a data obtainable span with a much broader range especially at lower monomer popula- tions where turbidity by spectrophotometry is quite inaccurate. Three methods of measuring turbidity were utilized. The first method measured the ratio of intensity of the scattered light, the Tyndall light, to that of the incident light by absolute or direct measurement of the Tyndall ratio. The second method measured the same effect as the first, but compared the intensities to a standard of known concentra-
Purchased for the exclusive use of nofirst nolast (unknown)
From: SCC Media Library & Resource Center (library.scconline.org)