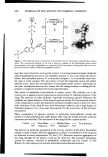
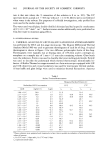
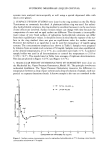
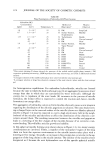
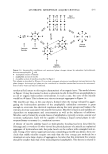
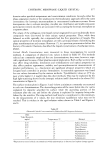
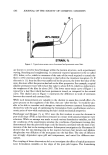
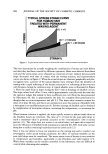
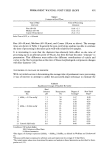
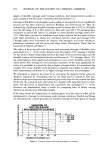
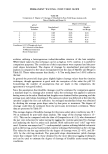
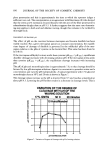
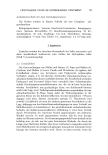
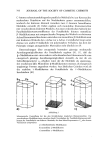
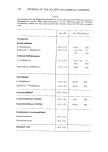
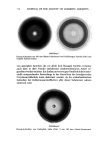
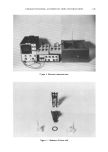
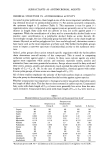
662 JOURNAL OF THE SOCIETY OF COSMETIC CHEMISTS rate is that rate where the % saturation of the solution is 0 to ca. 10%. The UV spectrum shows a peak ate. = 303 m/x with anE = 17,150. Beer's law is not followed when water is the solvent. For purposes of colloidal investigations, only profiled lots were used in the studies reported. The water used was all-glass, double-distilled deionized and had a specific conductance of 0.5-1.0 x 10 -6 ohm -• cm -•. Surface tension studies additionally were performed on CO,•-free water to minimize aging effects. B. INVESTIGATIONAL STUDIES 1. THERMAL ANALYSIS OF CRYSTALLINE NAFOXIDINE HYDROCHLORIDE was performed by DTA and hot-stage microscopy. The Dupont Differential Thermal Analyzer Model 900 was used to generate thermograms of each lot of drug. A typical thermogram is shown in' Figure 2 for two different polymorphic forms of the drug. Thermograms were typically run at heating rates of 10øC/min under a nitrogen at- mosphere on a sample size of 1 mm x 3.5 mm tube-containing volume. Glass beads were the reference. Form • was used to describe the lower melting polymorph. Form/• was used to describe the polymorph which showed thermotropic mesomorphic be- havior. A Kofler-Thomas hot stage mounted on a Leitz microscope equipped with 43X and 10X objectives and crossed polarizers was used for microscopic thermal analysis. A heat baffle and glass bridge were used to minimize thermal fluctuations. Aqueous Table I Surface Tension Measurements Nafoxidine HC1 Concentration Measured Surface Tension (3') 25øC 37øC mol/l mg/ml = C Log C to tx to tx 1.08 x 10 -• 50.0 1.7 53.3 a 51.6 2.17 x 10 -= 10.0 1.0 51.6 49.8 49.4 1.08 x 10 -2 5.0 0.7 49.5 49.8 49.8 6.49 x 10 a 3.0 0.5 50.4 a 48.7 4.33 x 10 -a 2.0 0.3 49.9 47.5 3.25 x 10 -a 1.5 0.2 49.8 a 47.3 2•17 x 10 -a 1.0 0.0 48.8 49.2 44.4 1.62 x 10 -a 0.75 -0.1 48.5 a 46.6 1.08 x 10 -a 0.50 -0.3 50.0 50.7 50.1 6.49 x 10 4 0.30 -0.5 53.7 •' 52.0 4.33 x 10 -4 0.20 --0.7 52.9 57.4 60.8 2.17 X 10 --4 0.10 --1.0 57.2 59.6 1.08 X 10 --4 0.05 -- 1.3 58.9 61.9 4.33 X 10 --5 0.02 --1.7 60.4 59.2 64.0 2.17 X 10 --.5 0.01 --2.0 68.2 68.3 67.0 1.08 X 10 --5 0.005 --2.3 67.2 66.8 4.33 X 10 --6 0.002 --2.7 68.5 69.0 2.17 X 10 --6 0.001 --3.0 69.3 49.6 49.3 46.2 44.3 49.4 54.5 58.5 • These solutions were prepared and measured at a later time to permit an evaluation of several intermediate values of interest. tx for 25øC was 1-3 days and tx for 37øC was 19 days. to represents initial values.

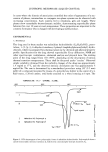
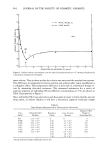
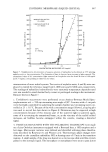
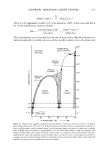
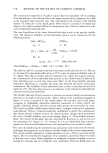
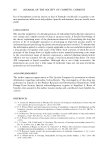
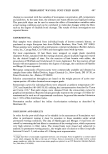
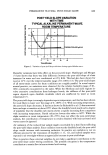
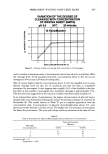
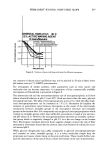
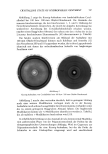
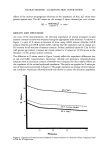
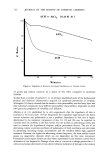
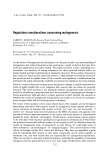
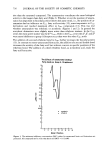
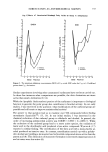
LYOTROPIC MESOPHASE (LIQUID CRYSTAL) 663 systems were analyzed microscopically as well using a special depressed slide with micro cover glasses. 2. SURFACE TENSION STUDIES were done by the ring method on the Du Noiiy Tensiometer as commonly described. A platinum-iridium ring was used. For nafoxi- dine hydrochloride solutions, the ring method is excellent because it can be used even if time effects are involved. Surface tension values can change with time because the composition of a new and an aged surface are different. Thus dynamic 3' (nonequilib- rium) values of very fresh surfaces of nafoxidine hydrochloride solutions can differ from their equilibrium 3' values. It should be borne in mind that the rupture of the sur- face in the ring method does not give an equilibrium value for surface tension. However the method is so rapid that it can be used for measuring 3' of rapidly aging systems. The concentrations employed are shown in Table I. Samples were prepared by dilution from an initial stock solution of 50 mg/ml. Samples were also equilibrated at the desired temperatures, 25 or 37øC, in a controlled water bath ---IøC. A jacketed sample holder was used in all determinations to control the temperature to 25.0 or 37.0øC (+0.5ø). The results listed in Table I are averages of triplicate determinations. The data are plotted in Figure 3 (25øC) and Figure 4 (37øC). 3. MOLECULAR WEIGHT DETERMINATIONS BY OSMOMETRY were done on the Mechrolab Inc. Vapor Pressure Osmometer, Model 301. The principle involves an isothermal distillation. The Vapor Pressure Osmometer measures the difference in temperature between a drop of pure solvent and a drop of solution of sample, each sus- pended on separate thermistor beads. A known sample is also run as a standard in the 75- E 65 z c• 60 I z o_ z • 55 m 50 45 4O 0 o ---• INITIAL VALUES, t o ß ---• LATER VALUES 25oc I I I I I I I 3 4 5 6 7 8 9 I0 CONCENTRATION NAFOXIDINE HCI (mg/ml) Figure 3. Surface tension-concentration curve for nafoxidine hydrochloride at 25øC showing critical micelie concentration minimum at 0.70 mg/ml.
Purchased for the exclusive use of nofirst nolast (unknown)
From: SCC Media Library & Resource Center (library.scconline.org)