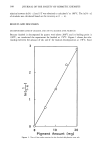
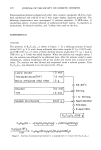
374 JOURNAL OF THE SOCIETY OF COSMETIC CHEMISTS WEIGHT LOSS Changes in the weight of samples were evaluated by determining dry weights before and after treatments. Samples were dried in a vacuum dessicator for 16 hours at 50øC, allowed to cool in weighing bottles, and weighed on an electrobalance to q- 0.01 mg accuracy. The percent weight loss was determined by the following equation: rn o -- rn 1 Weight loss (%) - X 100, ITI o where m o is the initial weight and m• is the weight after treatment. FORCE AND WORK REQUIRED FOR 20% EXTENSION The force and the work required to extend wet fibers 20% of their original length was measured on a constant-rate-of-extension tensile tester using a crosshead speed of 5 mm/min. Samples were extended to 20% and relaxed before any treatment was given. They were reextended after being subjected to 10, 20, and 30 cycles of chlorination and the respective cosmetic treatment. This test method has been recommended for the study of the effect of chemical modifications on the tensile properties of wool fibers (9). The percent reduction in force required to extend a fiber 20% after treatment was calculated using the following equation: F o - F 1 Force reduction (%) - X 100, Fo where F o is the initial force required to extend a fiber 20%, and F 1 is the force required to reextend the same fiber to 20% after treatment. The percent reduction in work required to extend a fiber 20% after treatment was calculated using the following equa- tion: W o - W• Work reduction (%) = x 100, Wo where XV o is the initial work required to extend a fiber 20%, and XX71 is the work required to reextend the same fiber to 20% after treatment. KNOT STRENGTH Knot strengths were measured to assess the change in flexibility of fibers with chlorina- tion. Knot strengths are generally lower than the straight strengths of fibers due to the initiation of breakage by the high extension of the outside layers of the fibers in the knot. Increased knot strength (approaching the straight strength) indicates an increase in the ductility of the fiber, allowing the fiber to adjust to the know configuration (10a). Two samples were cut from each blond hair fiber to be tested, one for fiber tenacity and the other for knot-breaking tenacity. The samples were brought to standard conditions, and the linear density was determined for each sample using an Insco Vibroscope ©. The knotted samples were prepared by forming a single, overhand knot in the center of each sample. Fiber tenacity and knot-breaking tenacity were measured on a constant-rate-of- extension tensile tester, using a crosshead speed of 10 mm/min and a gauge length of 20

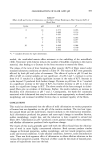
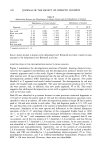
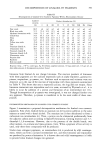
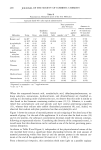
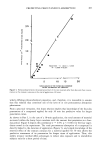
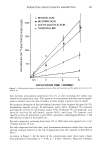
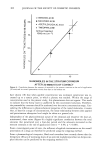
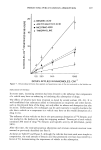
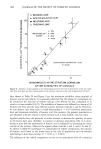
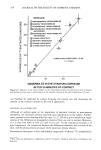
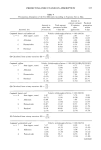
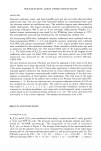
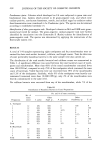
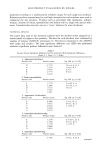
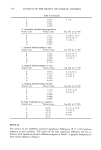
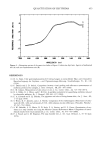
CHLORINATION OF HAIR AND pH 375 mm. The ratio of knot breaking tenacity to fiber tenacity (K/T) was then determined for each hair fiber. STATISTICAL ANALYSIS Statistical analysis computations were performed using various procedures of the Statis- tical Analysis System (SAS). The General Linear Model procedure and the Analysis of Variance procedure were used to analyze the sources of variation. Pairwise comparisons were used to determine differences between levels of a given source of variation. The t-test procedure was used to determine if the frictional values obtained on blond hair were significantly different from those obtained on brown hair, all other factors re- maining constant. All tests of significance were made at the 95 percent level. RESULTS AND DISCUSSION The effects of varying hydrogen ion concentration and number of one-hour cycles of treatment on average values of frictional parameters of brown and blond hair are shown in Table I. The results found in the two hair types were quite consistent, following similar trends. The control samples showed no significant difference between pH levels. In the chlorinated samples, however, pH provided significant effects. The average coef- ficients of friction of samples chlorinated in pH 2 solution were significantly higher Table I Effect of pH and Cycles of Chlorination on the Coefficient of Friction and Percent Stick of Brown Hair and Blond Hair Brown hair Blond hair Cycles pH • s* % Stick s • s % Stick s 0 10 0. 164 0.015 36.4 1. 140 0. 160 0.022 38.0 1.225 (control) 7 0. 130 0.017 36.6 1. 140 0. 132 0.013 36.8 0.837 2 0. 164 0.027 38.0 0.707 0. 148 0.016 36.8 1.095 1 2 0.258 0.015 45.0 2.550 0.216 0.015 43.8 1.924 3 2 0.274 0.005 45.2 1.304 0.272 0.004 47.8 1.483 5 10 0. 174 0.009 37.4 0.548 0. 182 0.018 37.2 1.924 7 0. 180 0.016 38.0 0.707 0. 180 0.014 38.6 0.548 2 0.296 0.023 45.6 1.817 0.374 0.019 63.0 3.606 10 10 0.156 0.019 37.6 0.894 0.174 0.018 37.4 1. 140 7 0.246 0.027 41.8 2. 168 0.222 0.031 42.8 3.033 2 0.360 0.021 56.6 5.320 0.352 0.008 63.0 3.606 15 10 0. 162 0.008 37.0 0.707 0. 178 0.034 38.0 0.707 7 0.244 0.021 43.2 1.483 0.220 0.014 43.6 1. 140 2 0.376 0.042 55.8 4.324 0.374 0.021 60.4 0.894 30 10 0. 160 0.021 41.8 0.837 0. 188 0.020 43.0 0.707 7 0.278 0.026 46.8 1.304 0.302 0.023 51.4 5.595 2 0.370 0.039 60.6 7.403 0.328 0.008 53.8 4.438 * s = standard deviation for five observations.
Purchased for the exclusive use of nofirst nolast (unknown)
From: SCC Media Library & Resource Center (library.scconline.org)